Method

Multi-target Tracking Algorithm Based on NC2 Adaptive Noise Covariance Estimation [la][on] [NC2]


Submitted on 23 Jun. 2021 13:07 by
Jiang Chao (University of science and technology of China)

Running time:0.01 s
Environment:1 core @ 3.0 Ghz (C/C++)

Method Description:
NC2 adaptive filtering and noise estimation method
are proposed to estimate the process and
measurement noise in real time, so as to improve
the stability and accuracy of tracking. NC2 is a
closed-loop estimation method based on estimation,
calibration and correction, which is different
from the existing adaptive covariance estimation
algorithms. First of all, there are less
restrictions on technical assumptions. It is
assumed that the system is asymptotically stable
rather than observable, and there is no
restriction on the dimensions of the state
transition matrix and the observation matrix.
Secondly, when the process and observation noises
are unknown, the noise covariance can also be
estimated.
Parameters:
python=3.7
Latex Bibtex:
@ARTICLE{10154170,
author={Jiang, Chao and Wang, Zhiling and Liang,
Huawei and Wang, Yajun},
journal={IEEE Transactions on Intelligent
Vehicles},
title={A Novel Adaptive Noise Covariance Matrix
Estimation and Filtering Method: Application to
Multiobject Tracking},
year={2024},
volume={9},
number={1},
pages={626-641},
keywords={Covariance matrices;Noise
measurement;Estimation;Correlation;Filtering;Calib
ration;Technological innovation;Kalman
filtering;adaptive estimation;process and
measurement noise covariance matrices;multiobject
tracking},
doi={10.1109/TIV.2023.3286979}}

Detailed Results

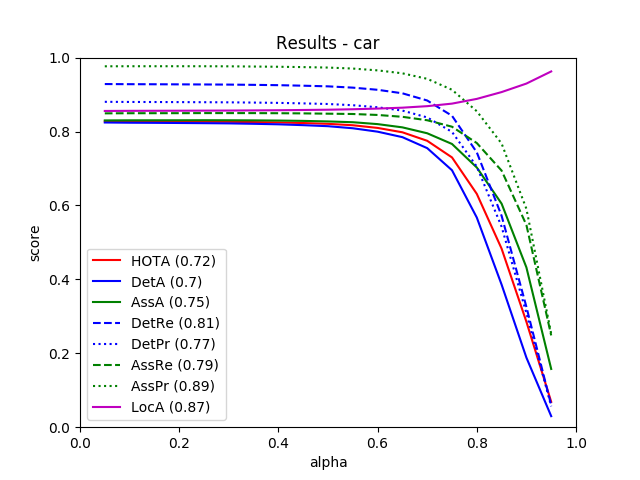
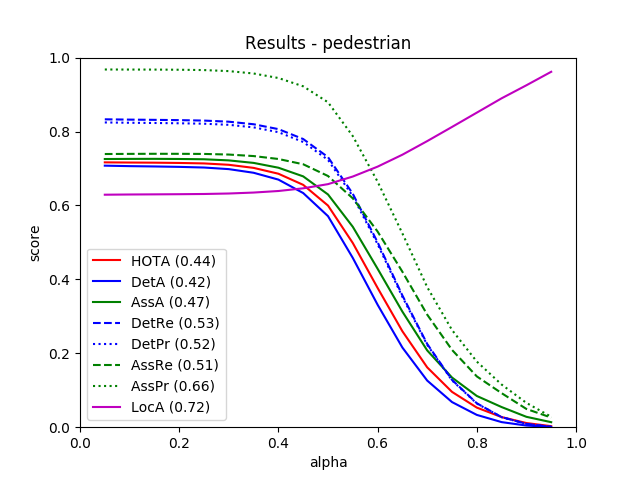
From all 29 test sequences, our benchmark computes the HOTA tracking metrics (HOTA, DetA, AssA, DetRe, DetPr, AssRe, AssPr, LocA) [1] as well as the CLEARMOT, MT/PT/ML, identity switches, and fragmentation [2,3] metrics. The tables below show all of these metrics.


Benchmark HOTA DetA AssA DetRe DetPr AssRe AssPr LocA
CAR 71.85 % 69.61 % 74.81 % 81.19 % 76.99 % 78.57 % 89.33 % 87.30 %
PEDESTRIAN 44.30 % 42.31 % 46.75 % 52.97 % 52.43 % 50.91 % 65.83 % 72.08 %

Benchmark TP FP FN
CAR 31716 2676 4554
PEDESTRIAN 16974 6176 6415

Benchmark MOTA MOTP MODA IDSW sMOTA
CAR 78.52 % 85.84 % 78.98 % 159 65.46 %
PEDESTRIAN 44.18 % 65.68 % 45.61 % 332 19.02 %

Benchmark MT rate PT rate ML rate FRAG
CAR 75.85 % 18.31 % 5.85 % 271
PEDESTRIAN 44.33 % 42.61 % 13.06 % 1431

Benchmark # Dets # Tracks
CAR 36270 1519
PEDESTRIAN 23389 1194

This table as LaTeX


This figure as: png pdf

This figure as: png pdf

[1] J. Luiten, A. Os̆ep, P. Dendorfer, P. Torr, A. Geiger, L. Leal-Taixé, B. Leibe: HOTA: A Higher Order Metric for Evaluating Multi-object Tracking. IJCV 2020.
[2] K. Bernardin, R. Stiefelhagen: Evaluating Multiple Object Tracking Performance: The CLEAR MOT Metrics. JIVP 2008.
[3] Y. Li, C. Huang, R. Nevatia: Learning to associate: HybridBoosted multi-target tracker for crowded scene. CVPR 2009.


eXTReMe Tracker