Method

Neural Network plus Plane [st] [NNP]


Submitted on 30 Apr. 2015 06:12 by
Andrew Berneshawi (University of Toronto)

Running time:5 s
Environment:4 cores @ 2.5 Ghz (Matlab)

Method Description:
Road pixels were classified using a neural network. The classification was done on superpixels produced for each image by spsstereo (http://ttic.uchicago.edu/~dmcallester/SPS/index.html). The feature vector for each superpixel consisted of the mean RGB color values, the average 2D position of the pixels and the average 3D position (derived from the disparity provided by spsstereo), the pitch and roll angles relative to the camera of the plane fit to the superpixel (using ransac), a flag as to whether the average 2D position was above the horizon line derived from the camera parameters, and the standard deviation of both the color values and 3D position. The network was trained in MATLAB using the neural network toolbox on the 289 training images. A plane was then fit using ransac to all network labelled road pixels. Outliers of this plane had their label confidence cut in half. The resulting labels were then smoothed using a dense CRF (http://graphics.stanford.edu/projects/densecrf/).
Parameters:
\superpixels=3000
Latex Bibtex:
@inproceedings{Chen2015NIPS,
title = {3D Object Proposals for Accurate Object
Class Detection},
author = {Xiaozhi Chen and Kaustav Kundu and Yukun
Zhu and Andrew Berneshawi and Huimin Ma and Sanja
Fidler and Raquel Urtasun},
booktitle = {NIPS},
year = {2015}
}

Evaluation in Bird's Eye View


Benchmark MaxF AP PRE REC FPR FNR
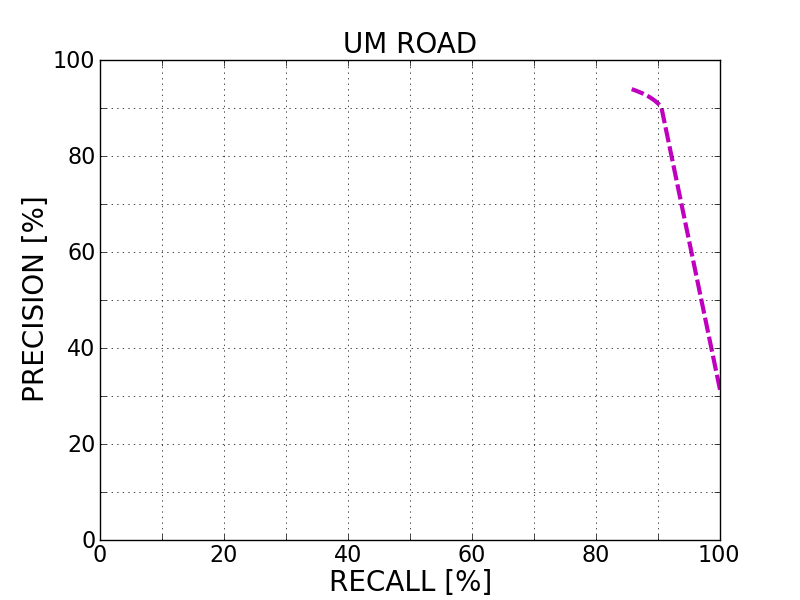
UM_ROAD 90.50 % 87.95 % 91.43 % 89.59 % 3.83 % 10.41 %
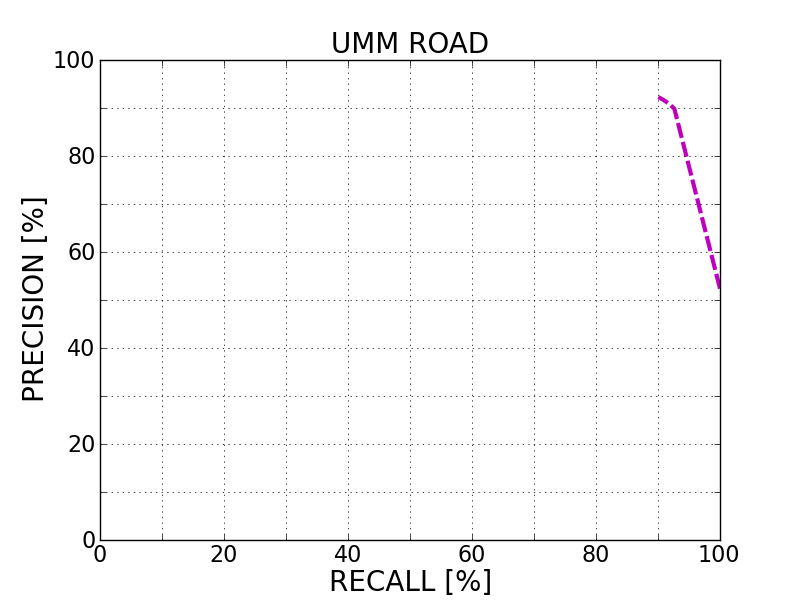
UMM_ROAD 91.34 % 88.65 % 91.07 % 91.60 % 9.87 % 8.40 %
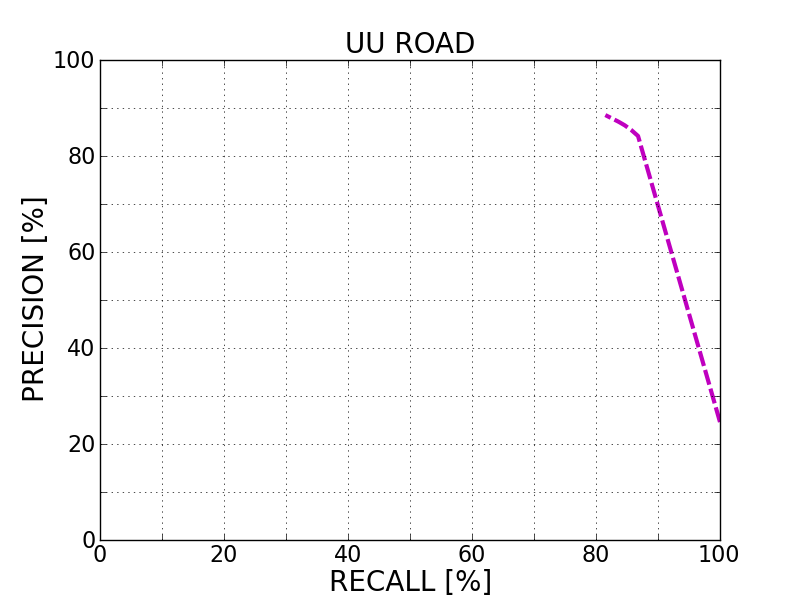
UU_ROAD 85.55 % 76.90 % 85.36 % 85.75 % 4.79 % 14.25 %
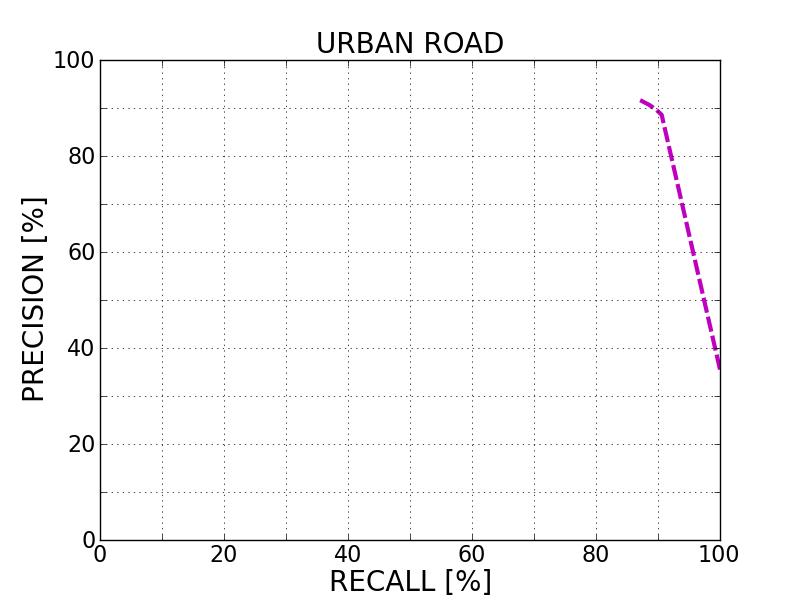
URBAN_ROAD 89.68 % 86.50 % 89.67 % 89.68 % 5.69 % 10.32 %
This table as LaTeX

Behavior Evaluation


Benchmark PRE-20 F1-20 HR-20 PRE-30 F1-30 HR-30 PRE-40 F1-40 HR-40
This table as LaTeX

Road/Lane Detection

The following plots show precision/recall curves for the bird's eye view evaluation.


This figure as: png eps pdf

This figure as: png eps pdf

This figure as: png eps pdf

This figure as: png eps pdf

Distance-dependent Behavior Evaluation

The following plots show the F1 score/Precision/Hitrate with respect to the longitudinal distance which has been used for evaluation.


Visualization of Results

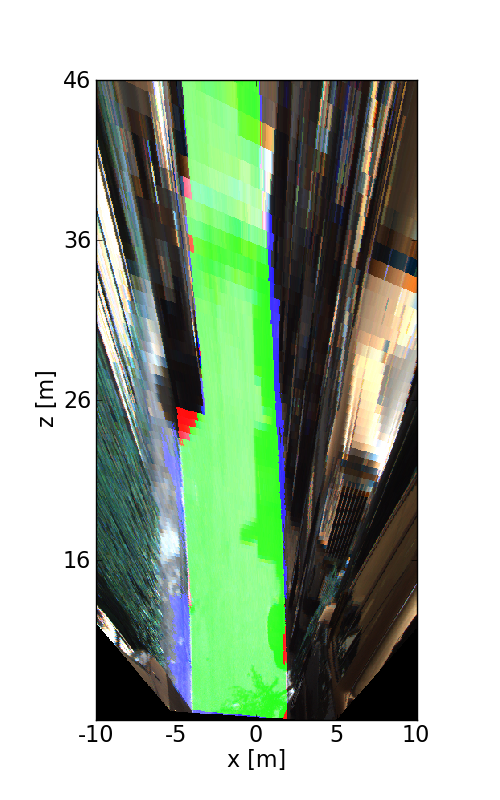
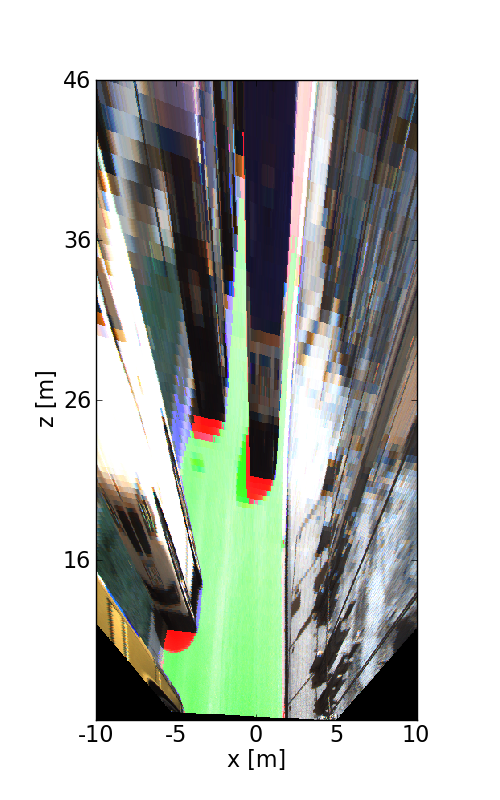
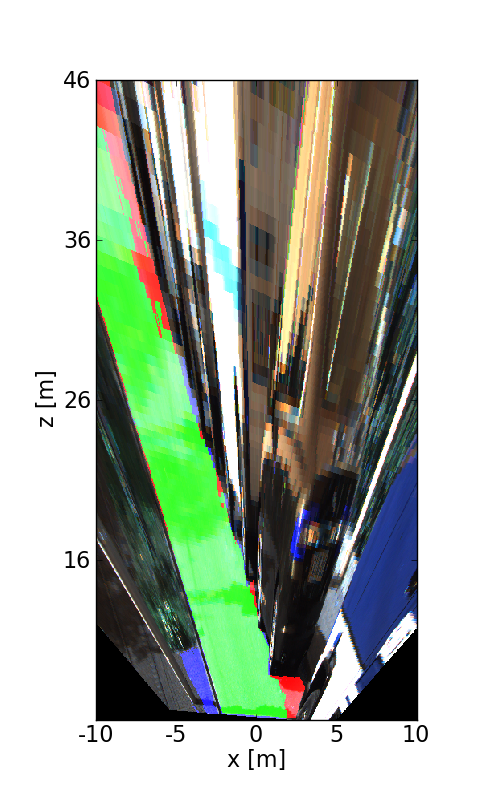
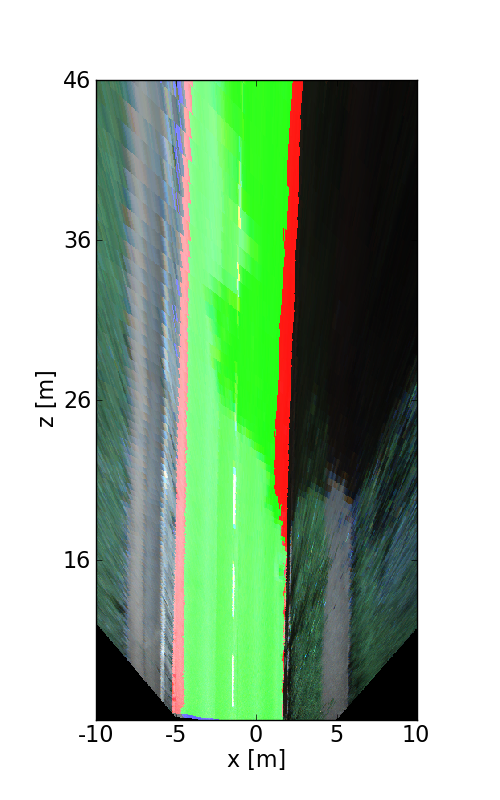
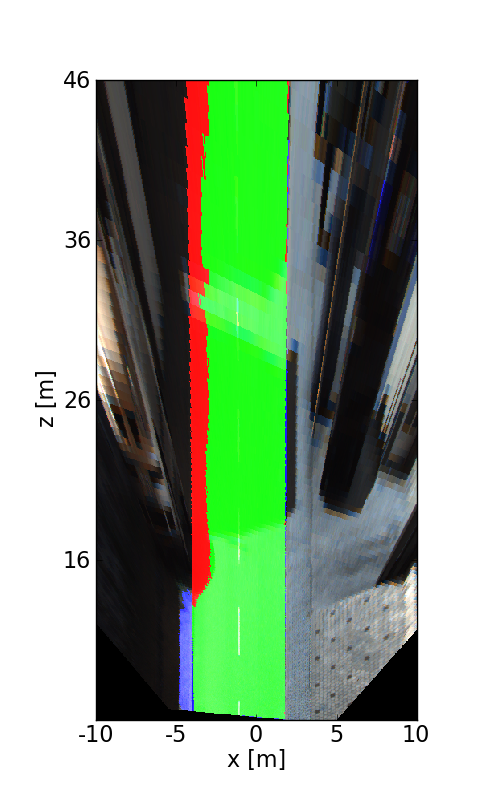
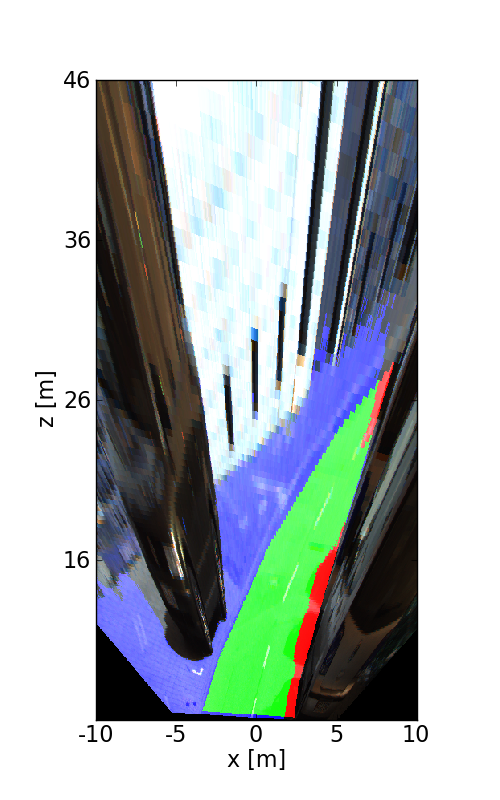
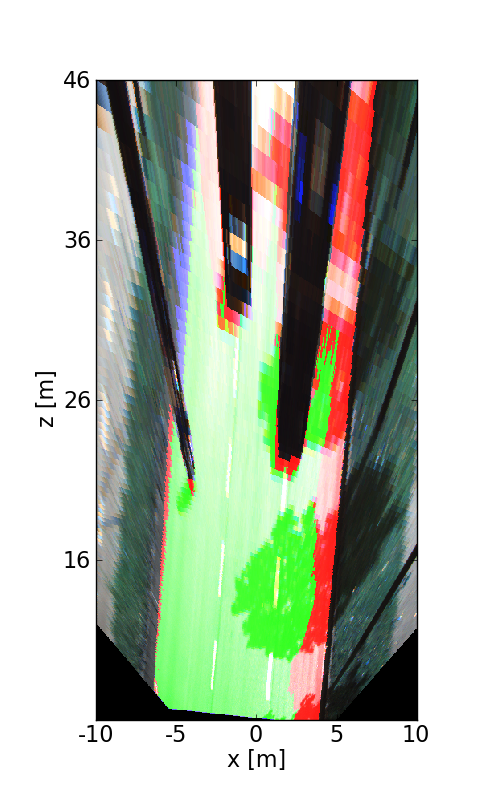
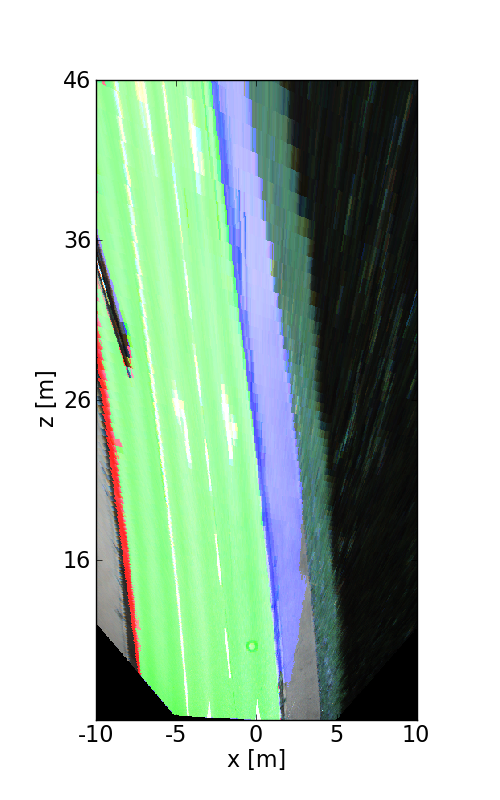
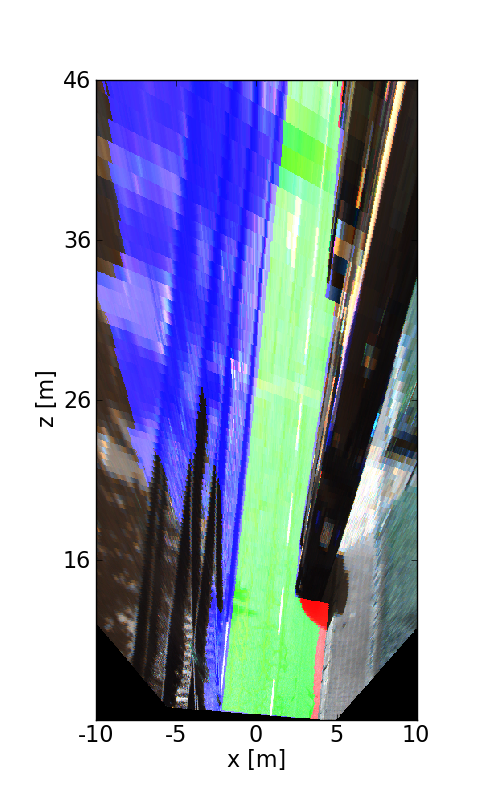
The following images illustrate the performance of the method qualitatively on a couple of test images. We first show results in the perspective image, followed by evaluation in bird's eye view. Here, red denotes false negatives, blue areas correspond to false positives and green represents true positives.


This figure as: png

This figure as: png

This figure as: png

This figure as: png

This figure as: png

This figure as: png

This figure as: png

This figure as: png

This figure as: png

This figure as: png

This figure as: png

This figure as: png

This figure as: png

This figure as: png

This figure as: png

This figure as: png

This figure as: png

This figure as: png


eXTReMe Tracker