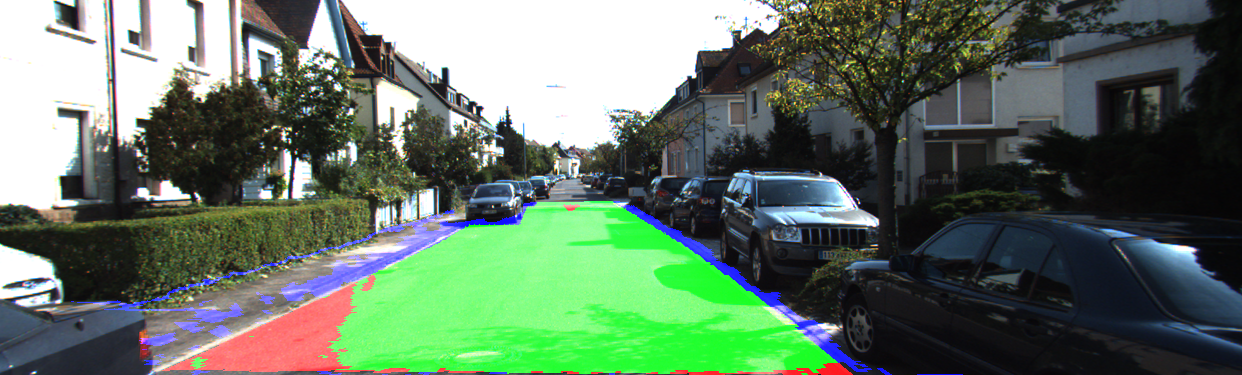
The following images illustrate the performance of the method qualitatively on a couple of test images. We first show results in the perspective image, followed by evaluation in bird's eye view. Here, red denotes false negatives, blue areas correspond to false positives and green represents true positives.
 This figure as: png 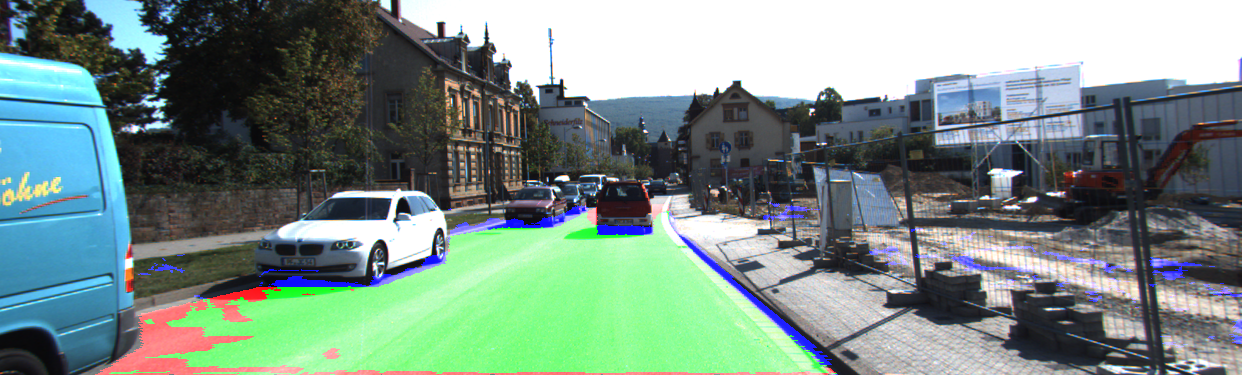 This figure as: png 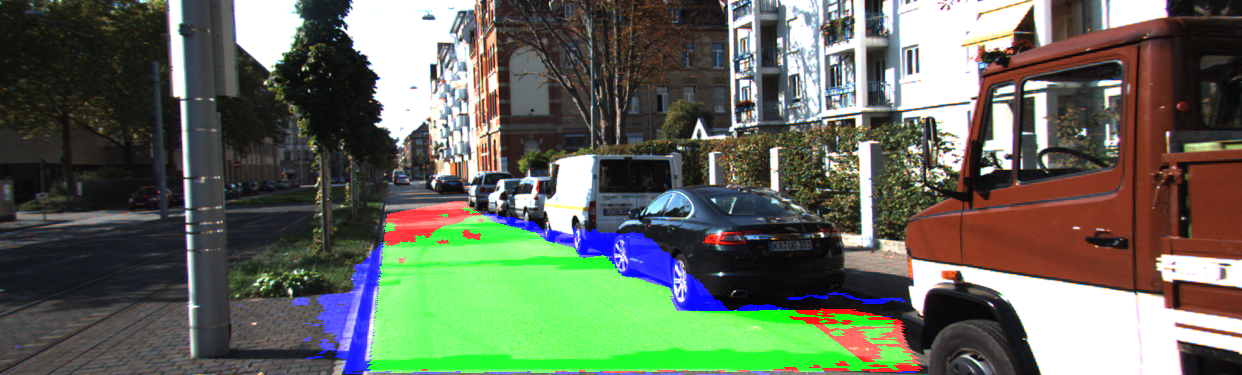 This figure as: png 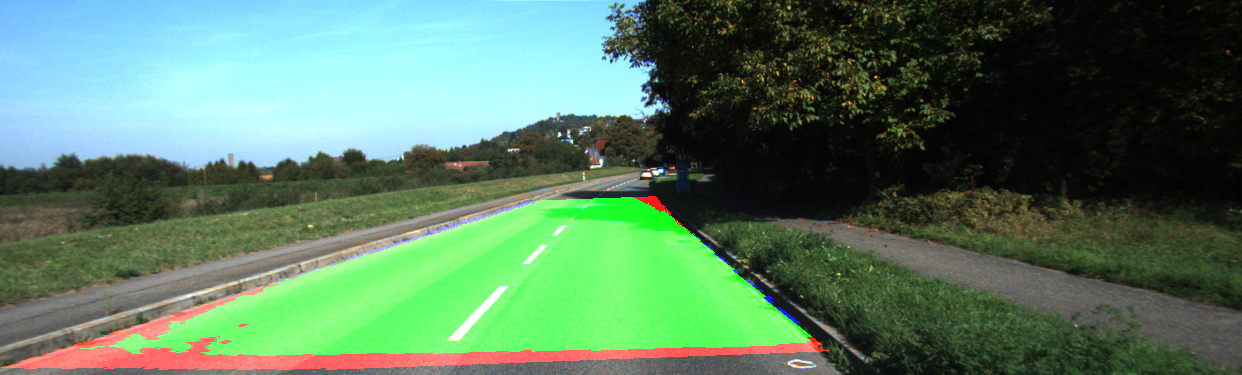 This figure as: png 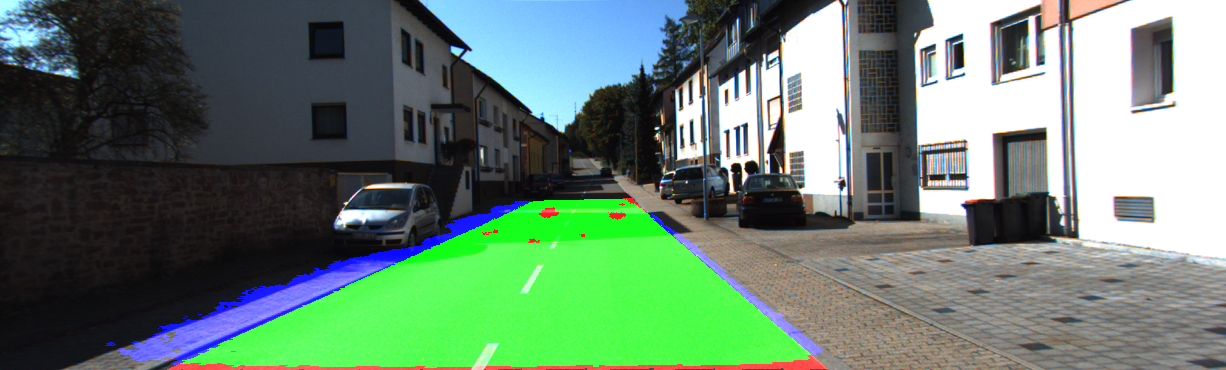 This figure as: png 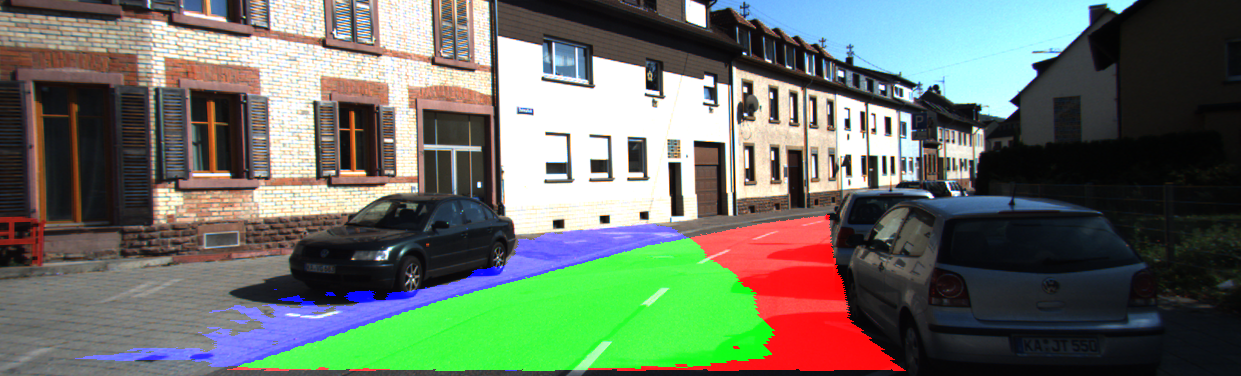 This figure as: png 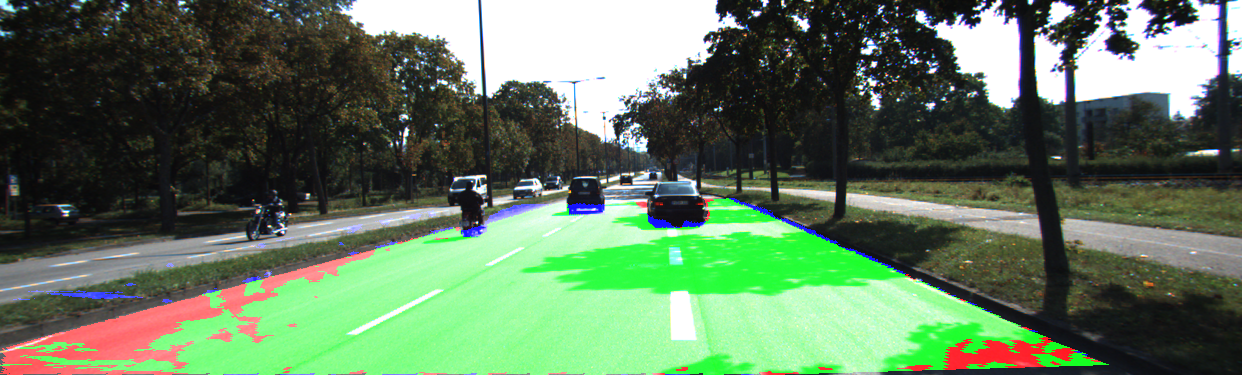 This figure as: png 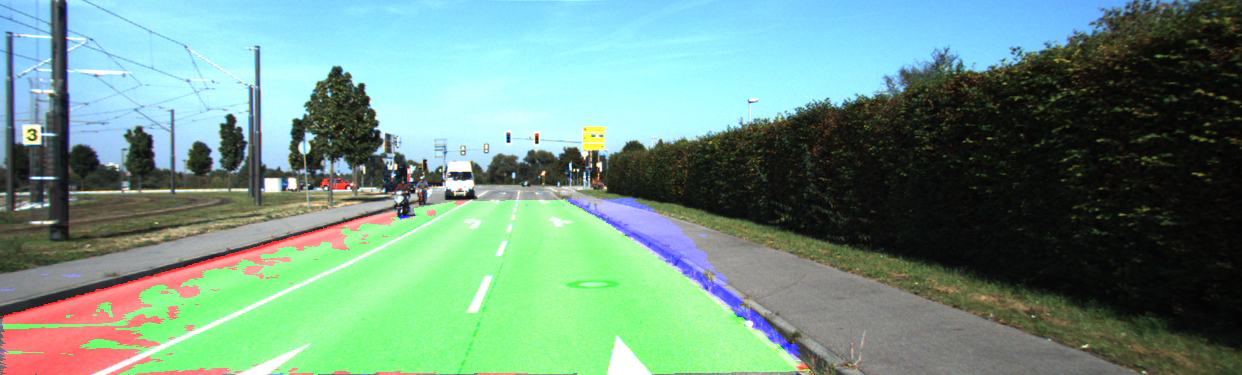 This figure as: png 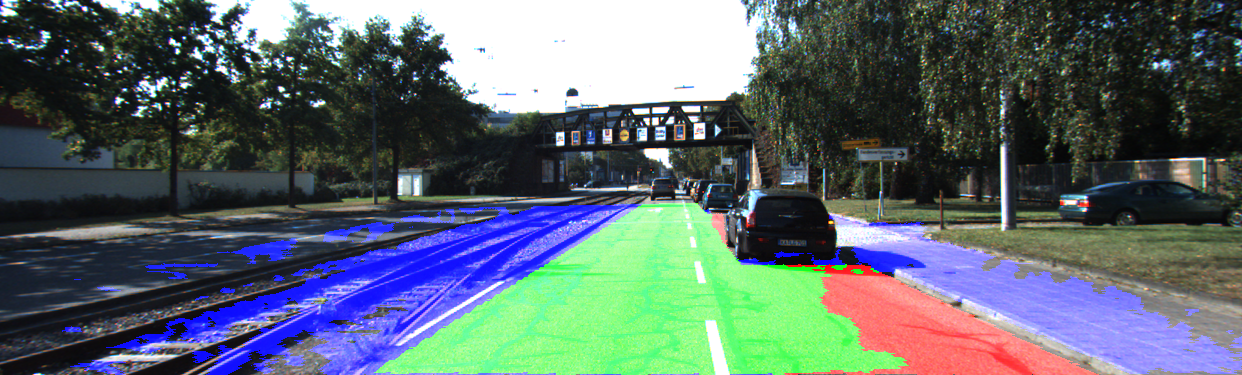 This figure as: png 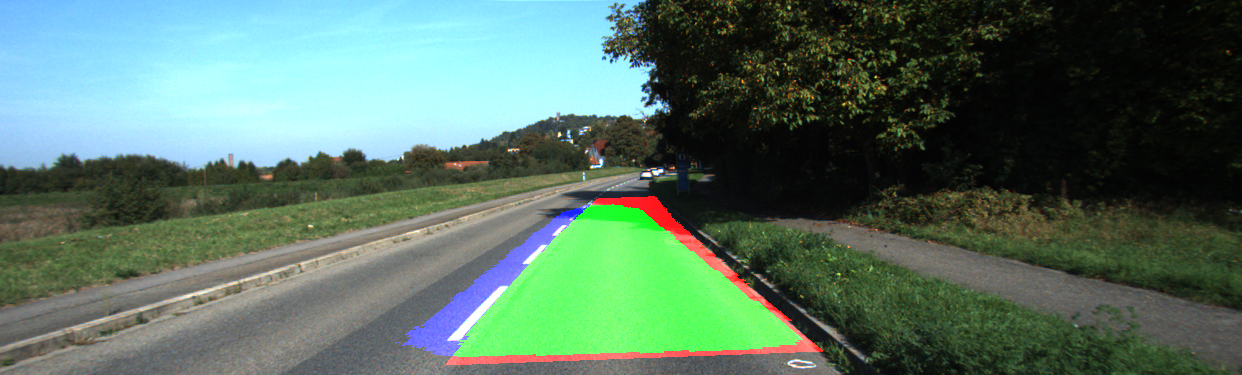 This figure as: png 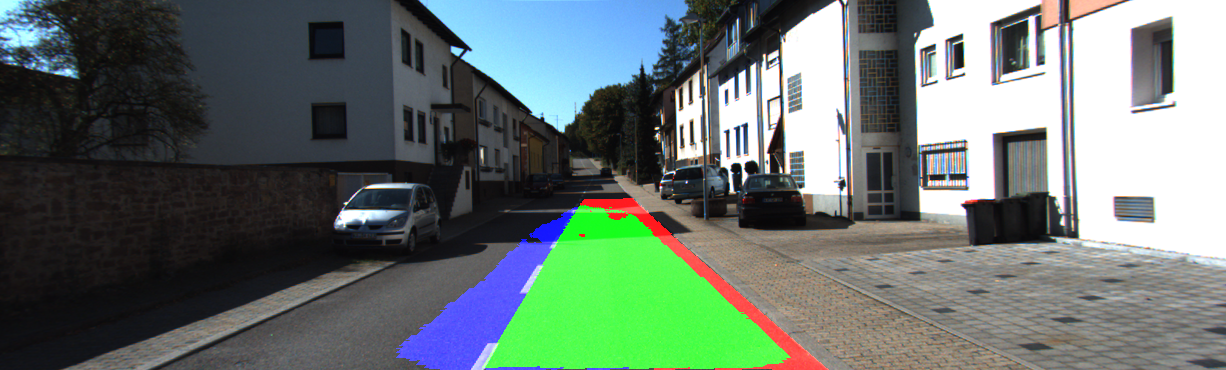 This figure as: png 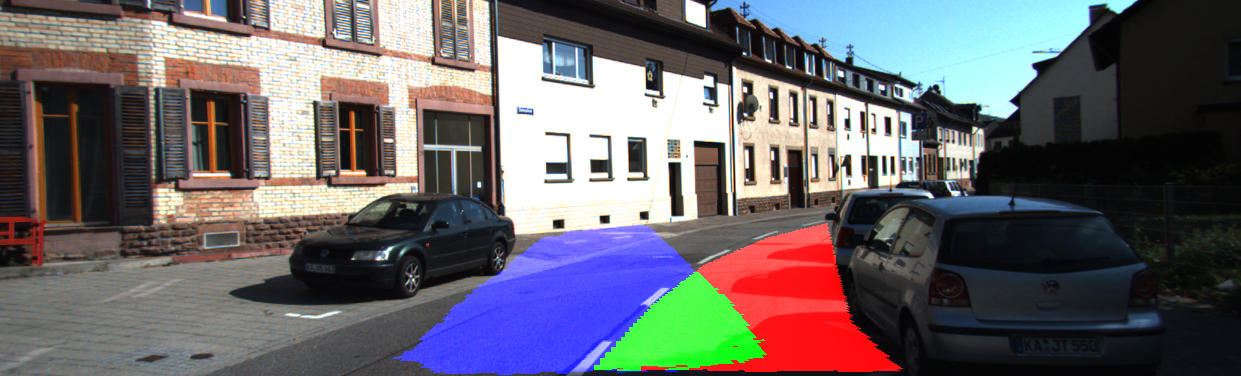 This figure as: png 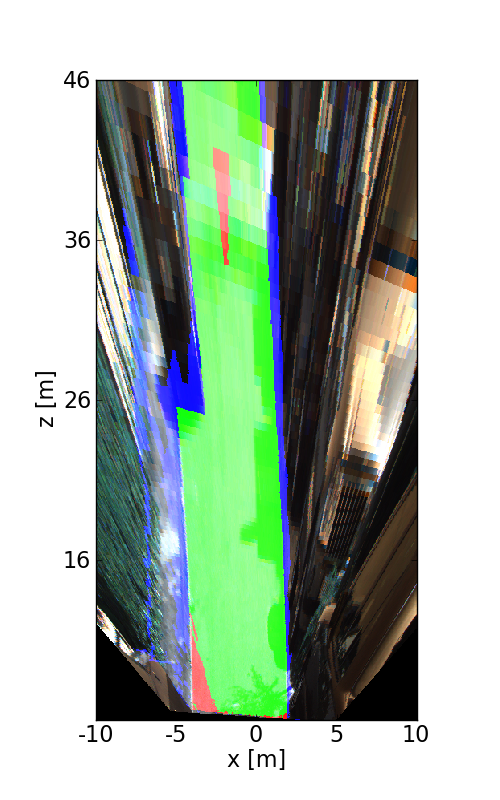 This figure as: png 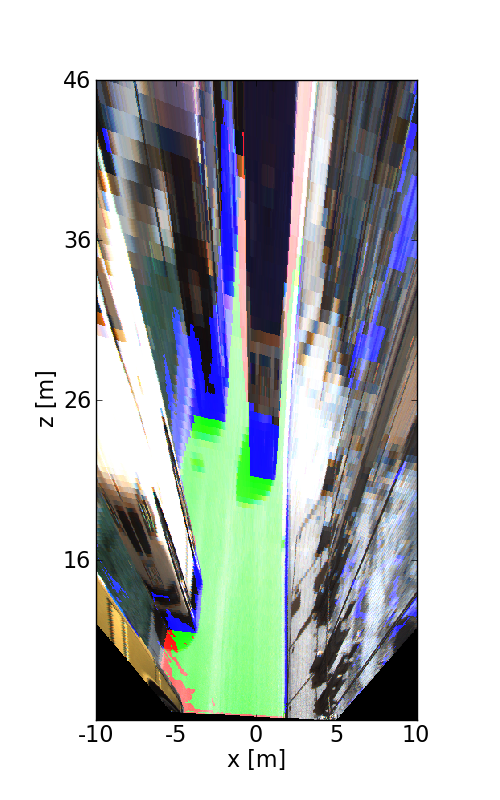 This figure as: png 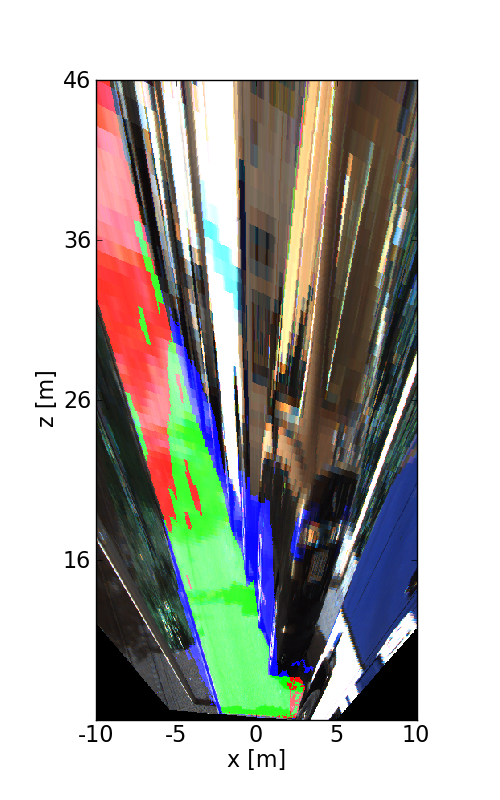 This figure as: png 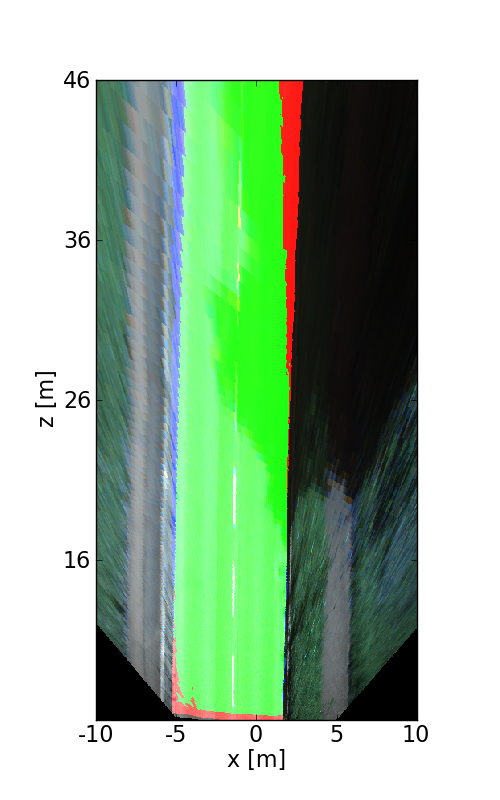 This figure as: png 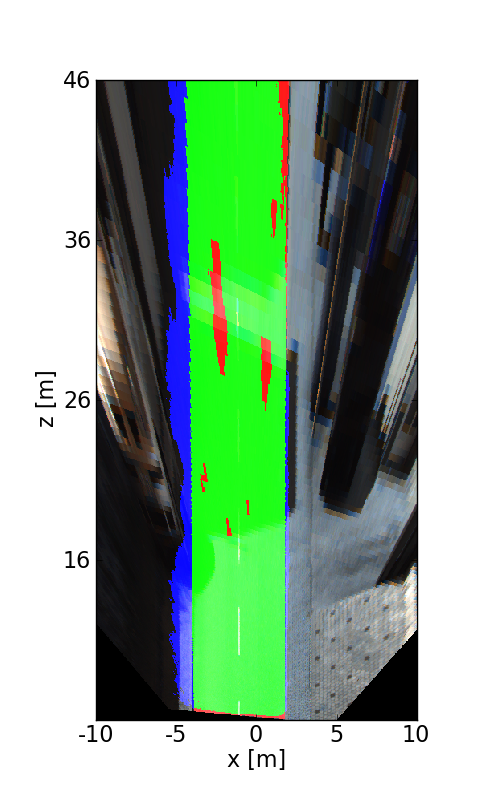 This figure as: png 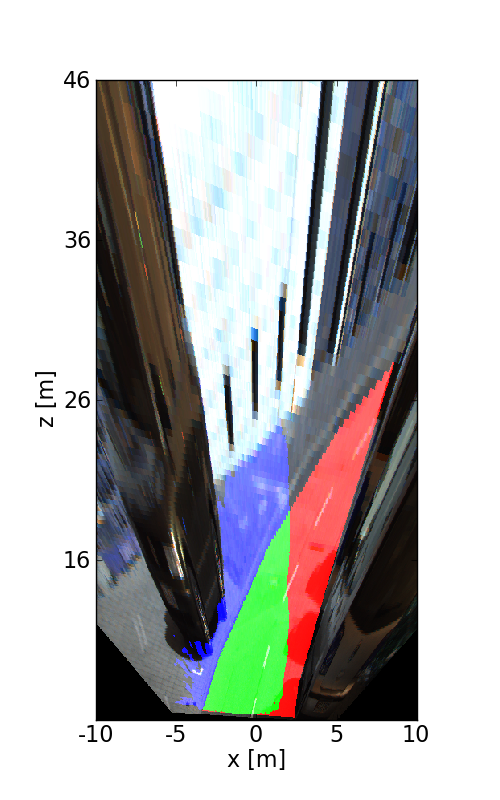 This figure as: png 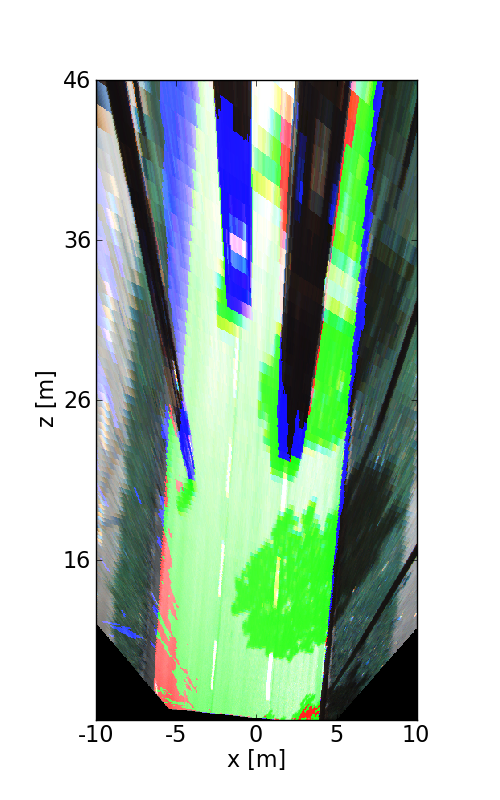 This figure as: png 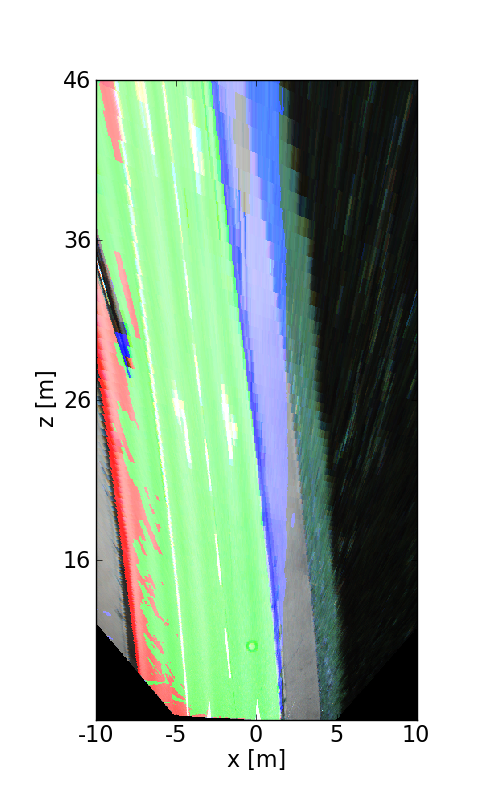 This figure as: png 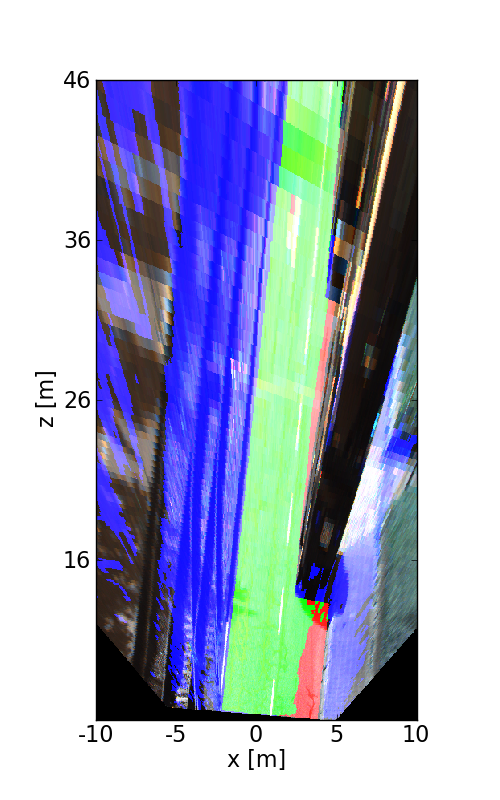 This figure as: png 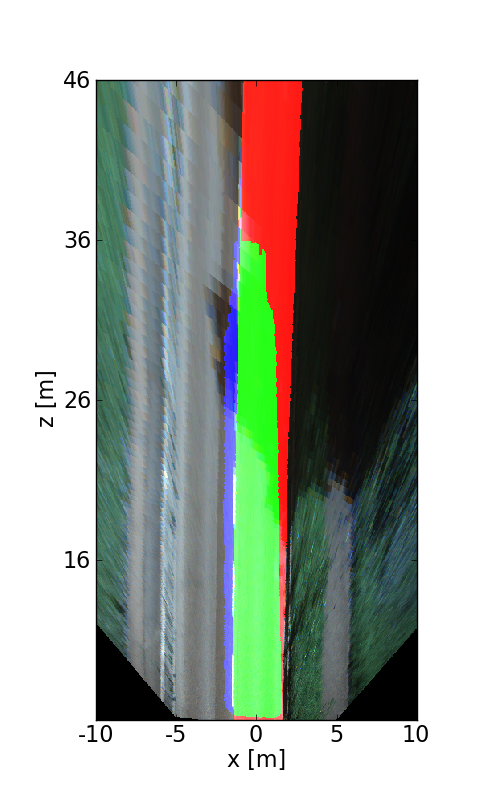 This figure as: png 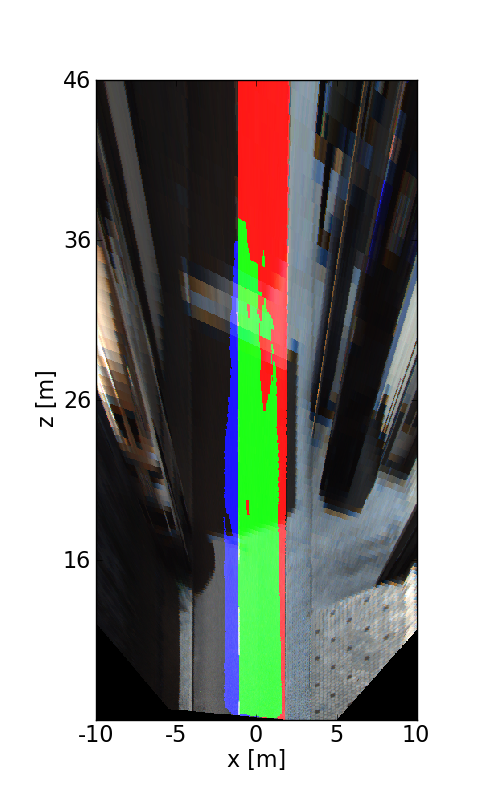 This figure as: png 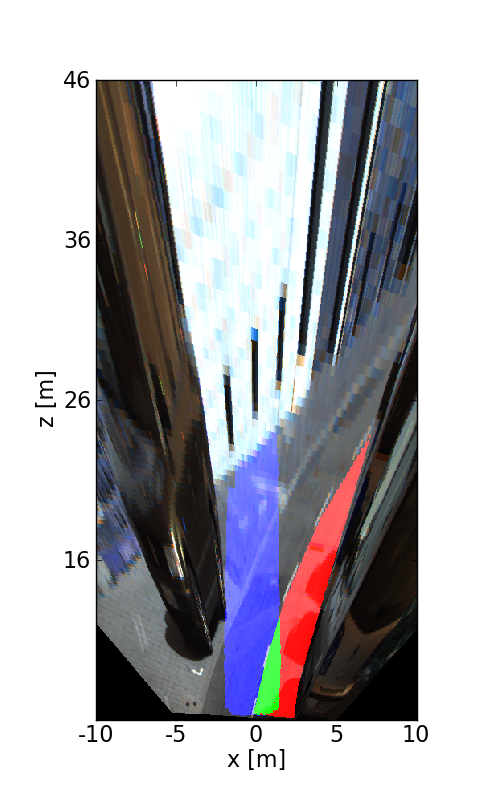 This figure as: png 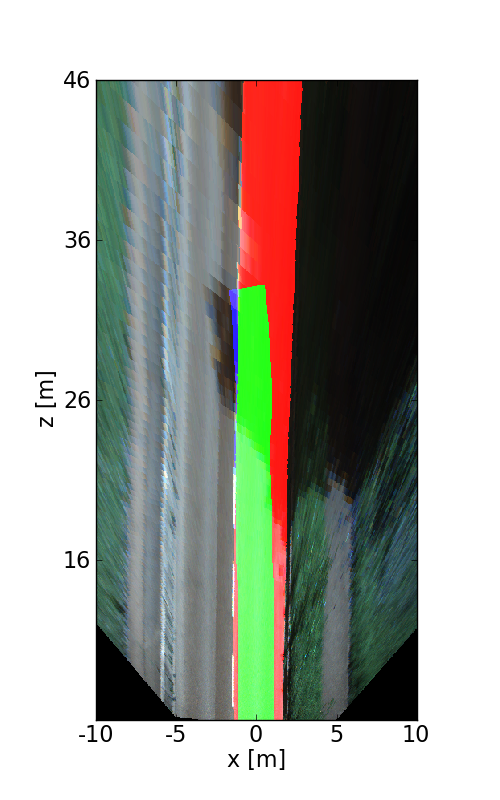 This figure as: png 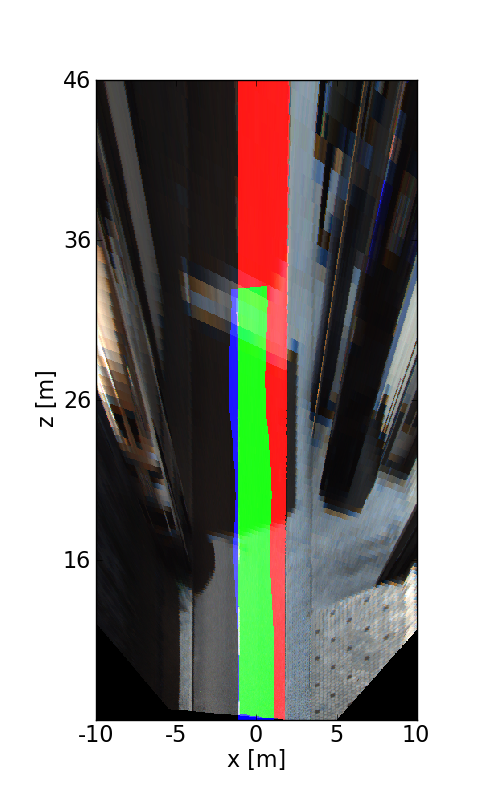 This figure as: png 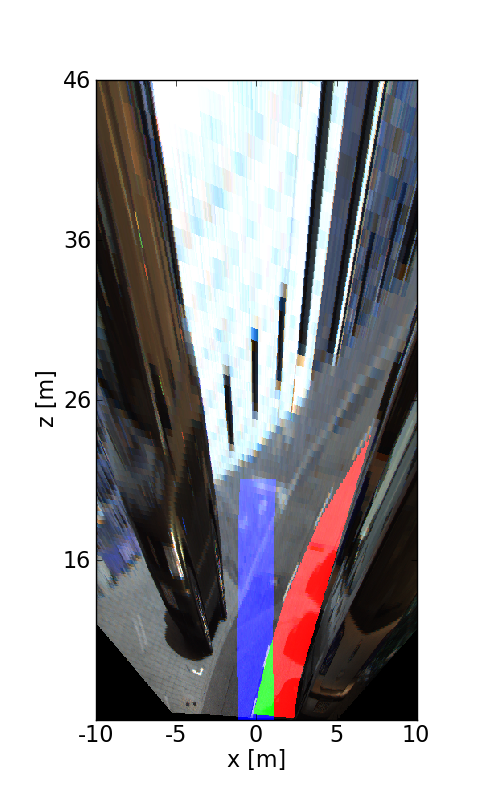 This figure as: png |