Method

Deep FCN with Random Data Augmentation for Enhanced Generalization in Road Detection [DEEP-DIG]


Submitted on 5 Jul. 2017 16:12 by
Jesús Muñoz Bulnes (Universidad de Alcala (UAH))

Running time:0.14 s
Environment:GPU @ 3.5 Ghz (Python + C/C++)

Method Description:
ResNet-101 Fully Convolutional Network with 4
upsampling steps with bilinear kernels and 3
skip connections. Model pretrained on ImageNet
and finetuned on the images of KITTI Road
training set in Bird's Eye View, with random
data augmentation recipes performed on training
time. These recipes include geometric
transformations (affine and perspective
transformations, mirroring, cropping and
distortion) and pixel-value changes (noise,
blur, color-space changes).

The model runs on GPU using Caffe deep learning
framework. Its Python interface is used to
define prototypes and control training process.
Also a custom data layer written in Python is
used to preprocess the images and its labels,
perform data augmentation and pass them to the
network during training. This code runs on a
single CPU core.
Parameters:
Stochastic Gradient Descent (SGD)
lr = 5e-5
wd = 5e-4
batch size = 1
momentum = 0.99
iterations = 20k
Latex Bibtex:
@inproceedings{munoz-bulnes_deep_2017,
author = {Muñoz-Bulnes, Jesús and
Fernandez, Carlos and Parra, Ignacio and
Fernández-Llorca, David and Sotelo, Miguel A.},
title = {Deep {Fully} {Convolutional}
{Networks} with {Random} {Data} {Augmentation}
for {Enhanced} {Generalization} in {Road}
{Detection}},
booktitle = {Workshop on {Deep}
{Learning} for {Autonomous} {Driving} on {IEEE}
20th {International} {Conference} on
{Intelligent} {Transportation} {Systems}},
address = {Yokohama, Japan},
month = oct,
year = {2017},
}

Evaluation in Bird's Eye View


Benchmark MaxF AP PRE REC FPR FNR
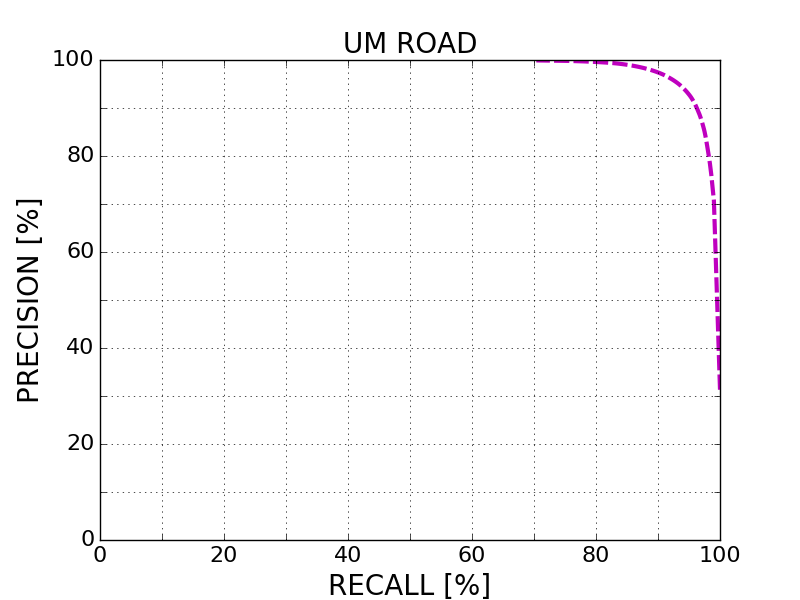
UM_ROAD 94.16 % 93.41 % 95.02 % 93.32 % 2.23 % 6.68 %
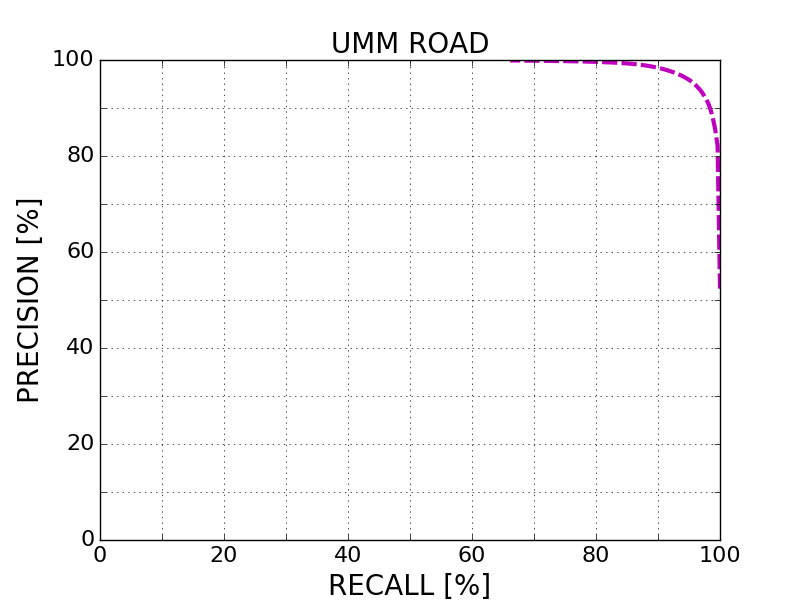
UMM_ROAD 95.45 % 95.41 % 95.49 % 95.41 % 4.96 % 4.59 %
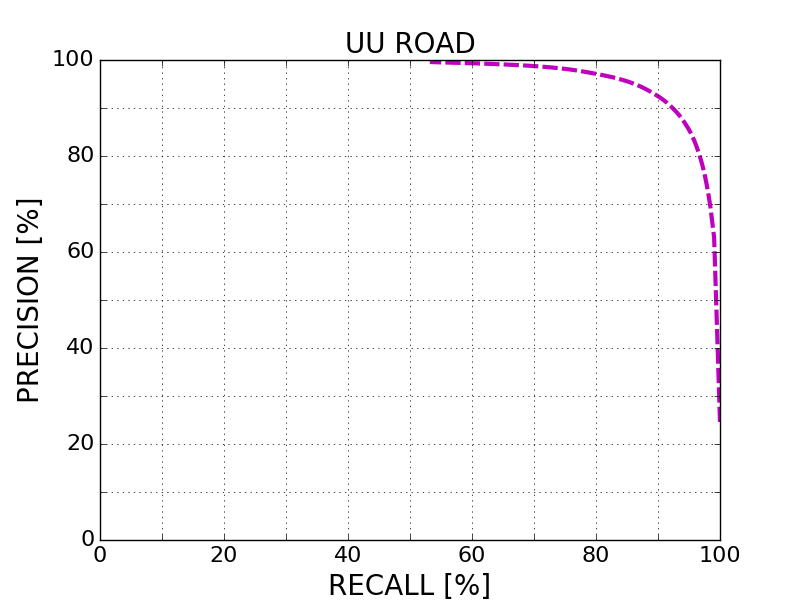
UU_ROAD 91.27 % 91.77 % 91.32 % 91.22 % 2.82 % 8.78 %
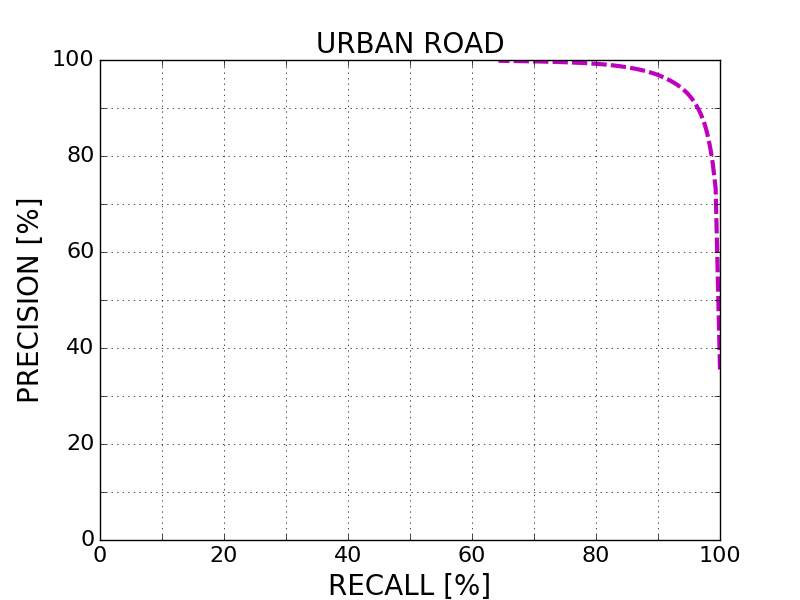
URBAN_ROAD 93.98 % 93.65 % 94.26 % 93.69 % 3.14 % 6.31 %
This table as LaTeX

Behavior Evaluation


Benchmark PRE-20 F1-20 HR-20 PRE-30 F1-30 HR-30 PRE-40 F1-40 HR-40
This table as LaTeX

Road/Lane Detection

The following plots show precision/recall curves for the bird's eye view evaluation.


This figure as: png eps pdf

This figure as: png eps pdf

This figure as: png eps pdf

This figure as: png eps pdf

Distance-dependent Behavior Evaluation

The following plots show the F1 score/Precision/Hitrate with respect to the longitudinal distance which has been used for evaluation.


Visualization of Results

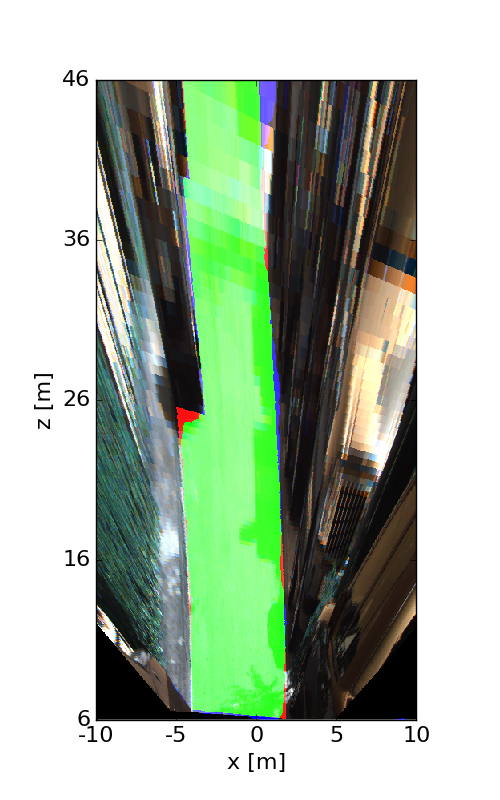
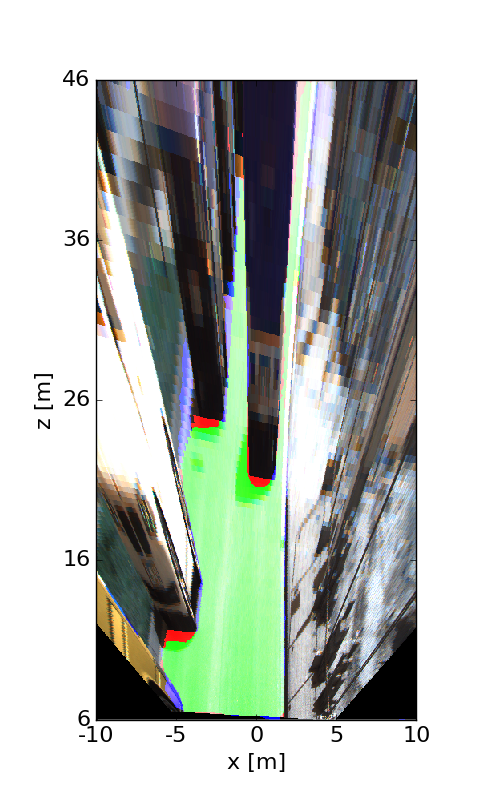
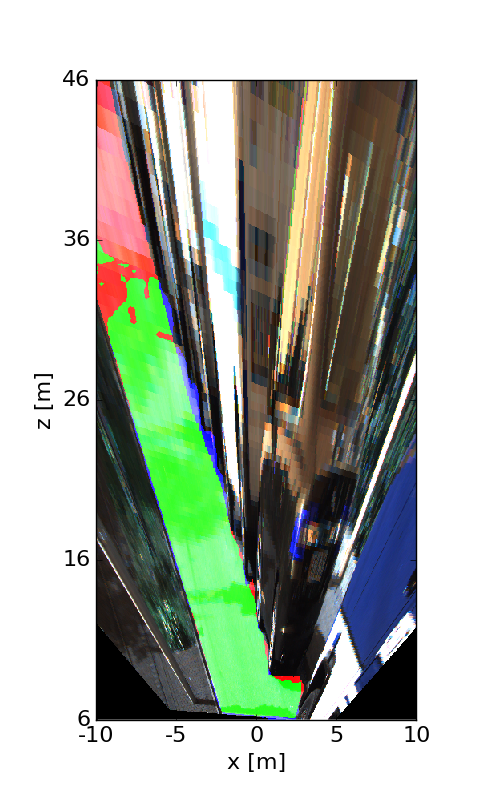
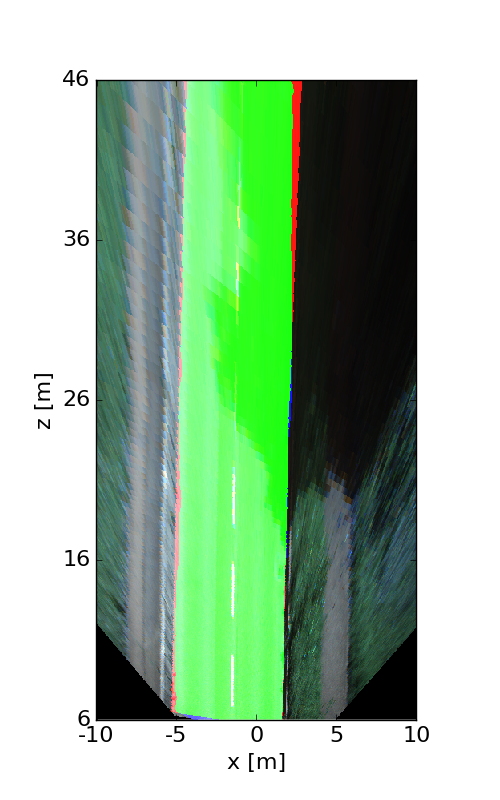
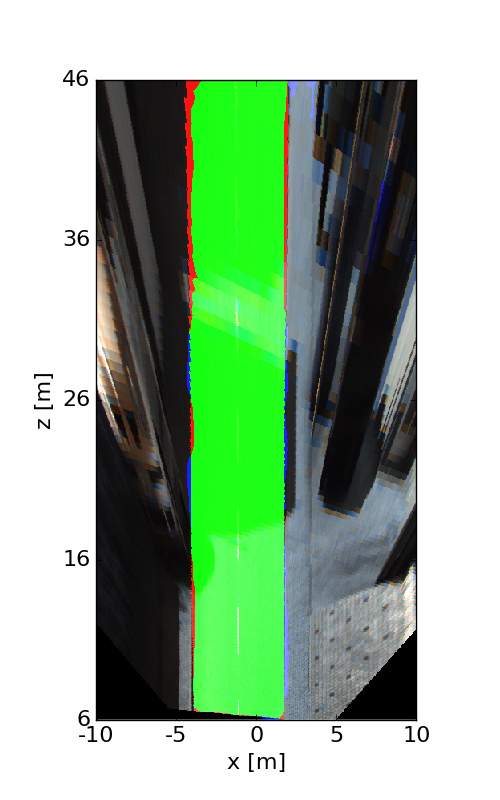
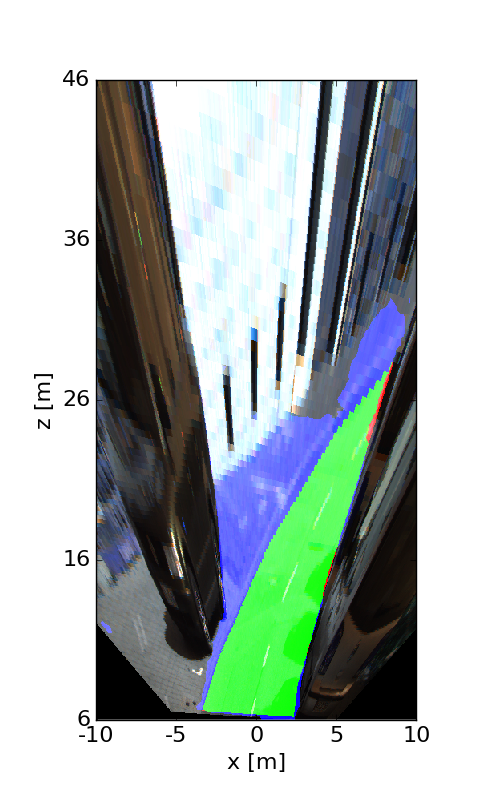
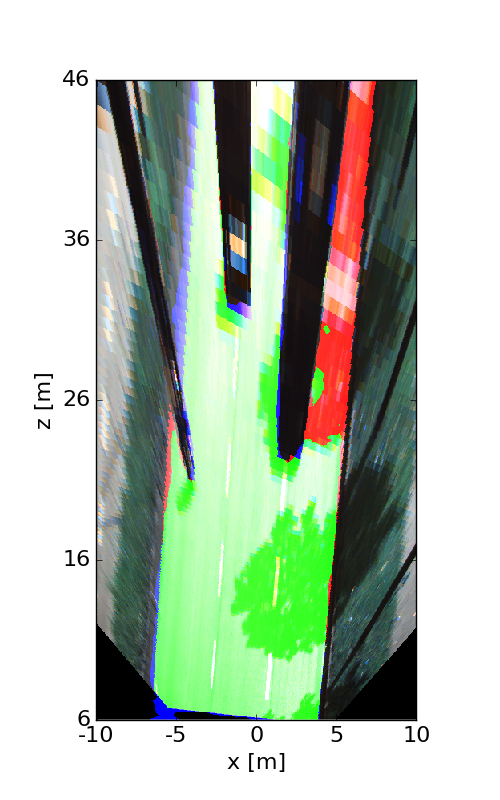
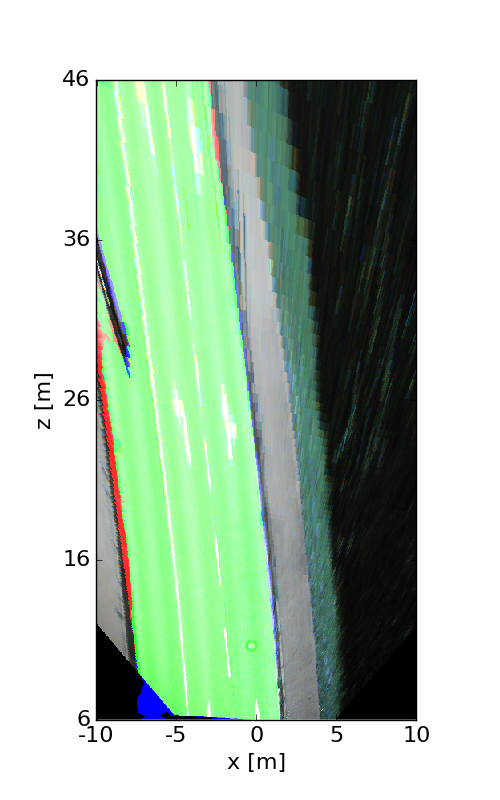
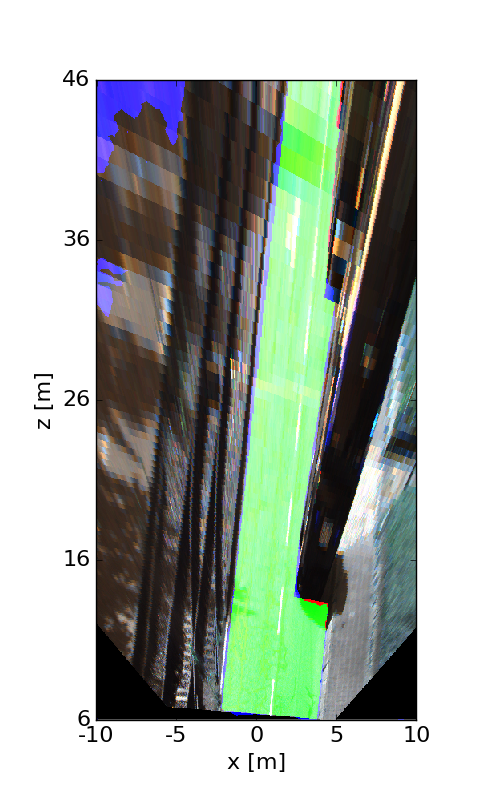
The following images illustrate the performance of the method qualitatively on a couple of test images. We first show results in the perspective image, followed by evaluation in bird's eye view. Here, red denotes false negatives, blue areas correspond to false positives and green represents true positives.


This figure as: png

This figure as: png

This figure as: png

This figure as: png

This figure as: png

This figure as: png

This figure as: png

This figure as: png

This figure as: png

This figure as: png

This figure as: png

This figure as: png

This figure as: png

This figure as: png

This figure as: png

This figure as: png

This figure as: png

This figure as: png


eXTReMe Tracker