


https://github.com/abdo-eldesokey/nconv Submitted on 1 Jun. 2018 16:15 by Abdelrahman Eldesokey (Linköping University)
|
Method
Detailed Results
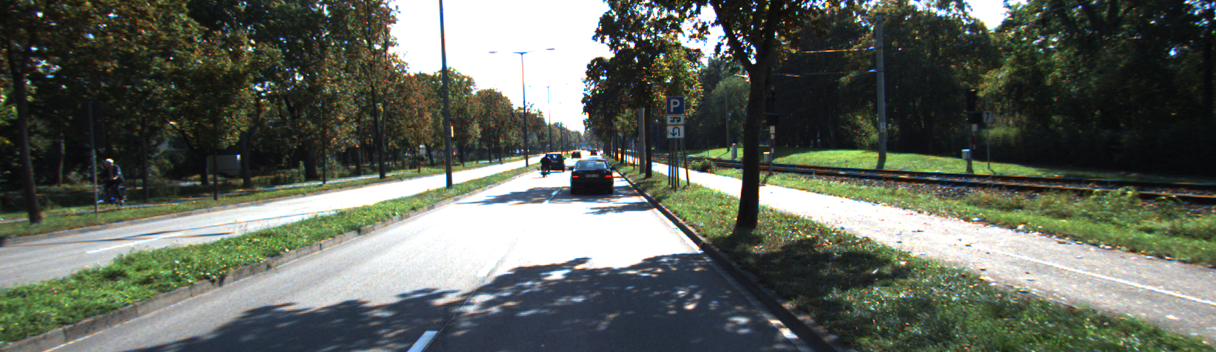
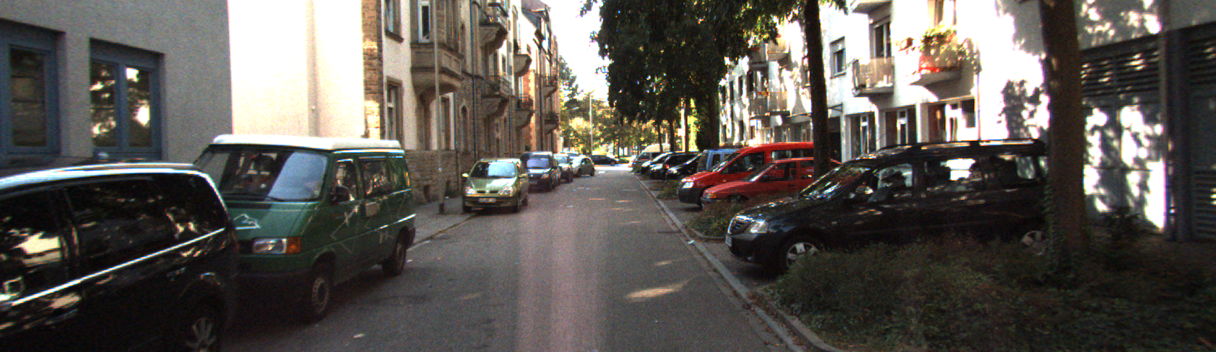
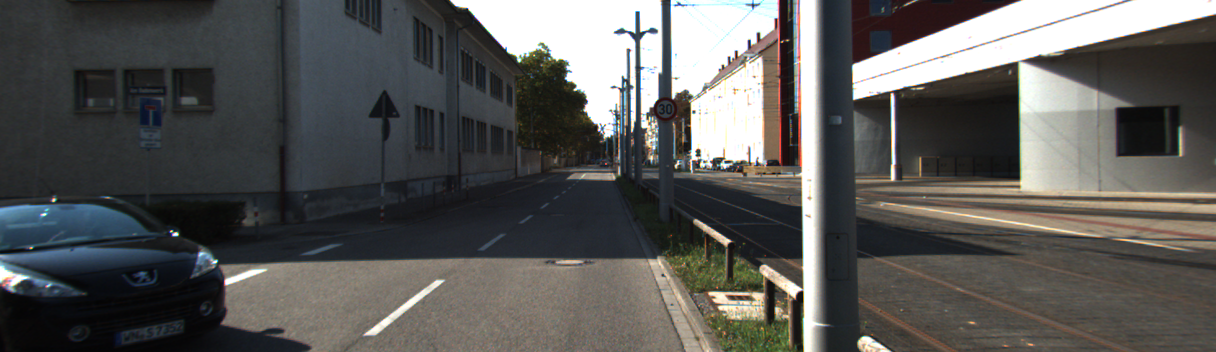
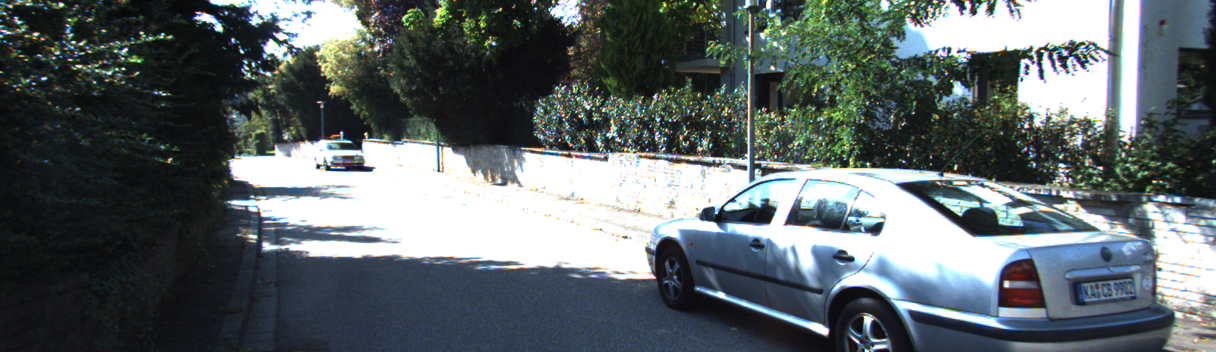
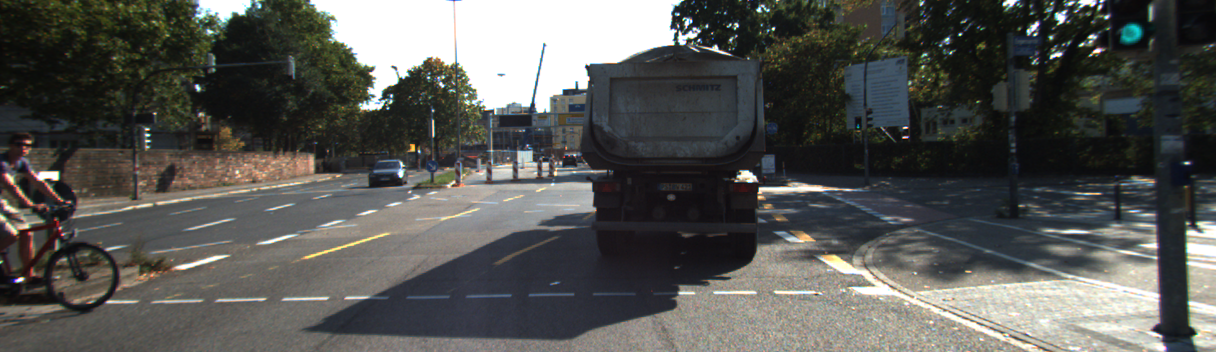
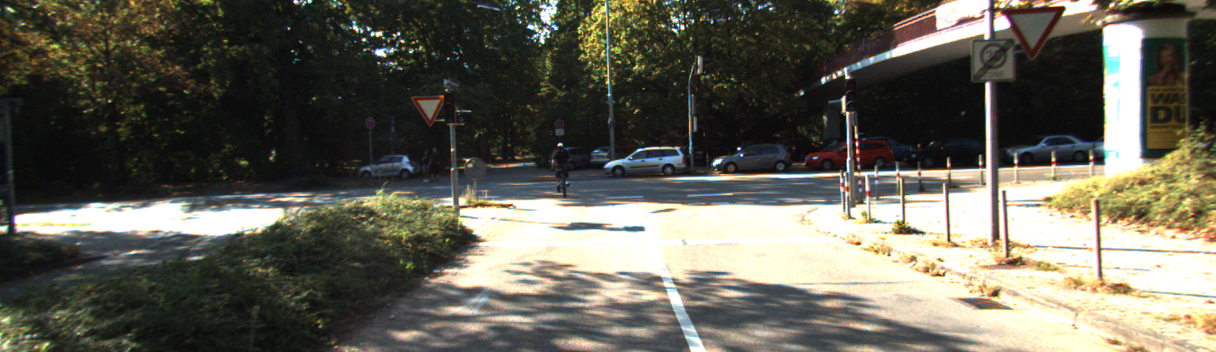
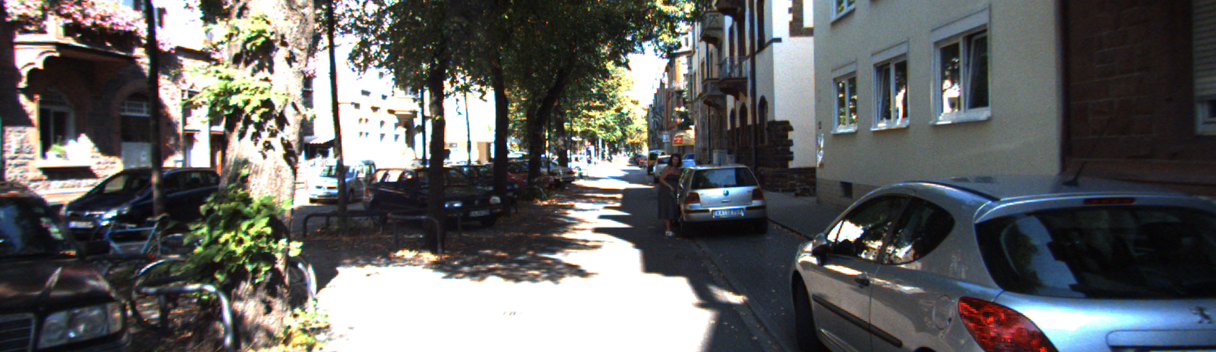
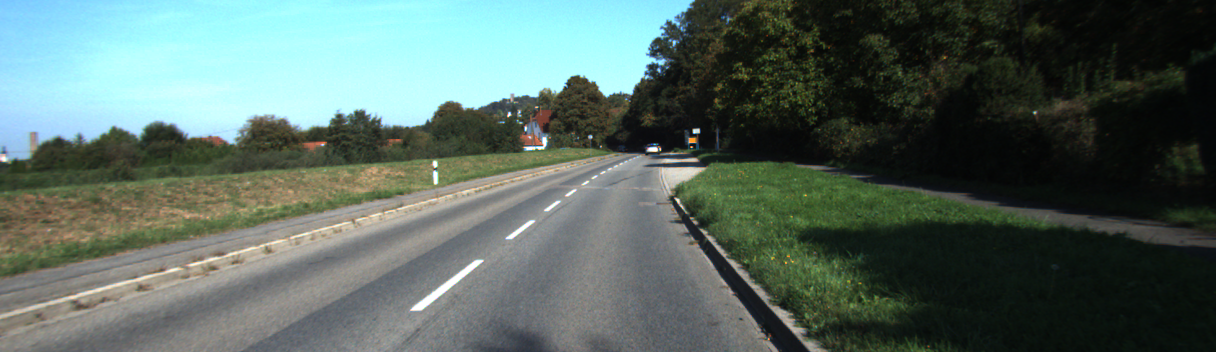
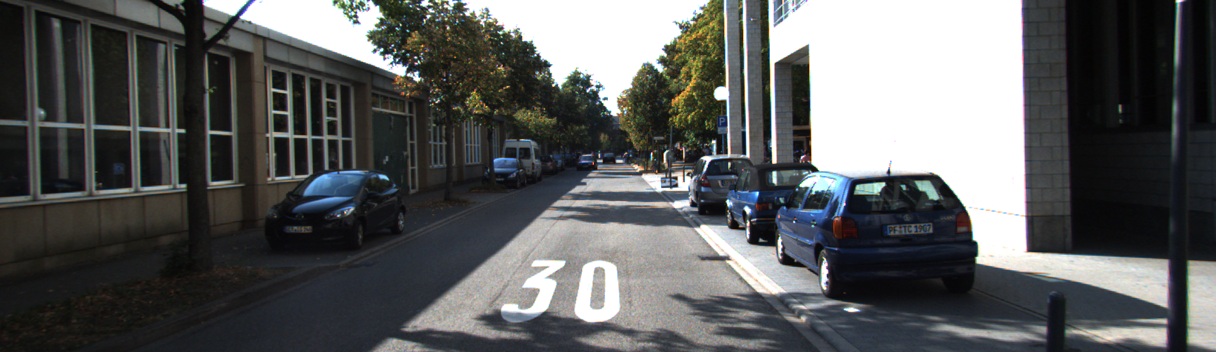
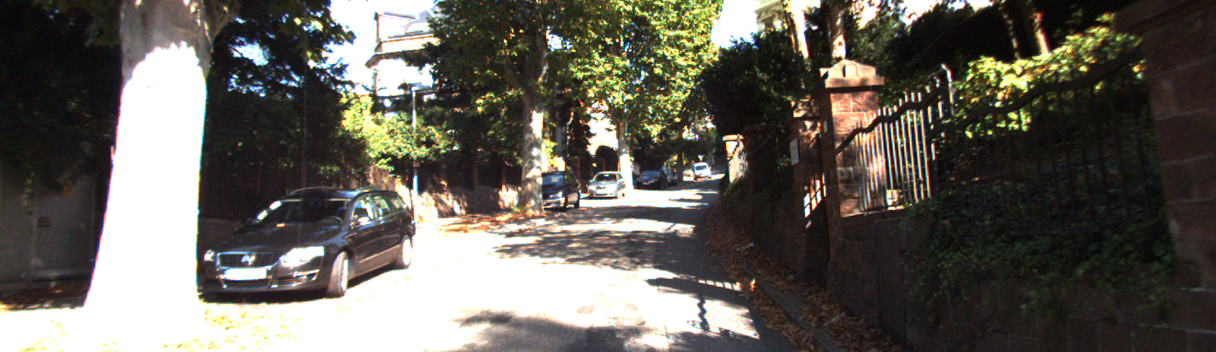
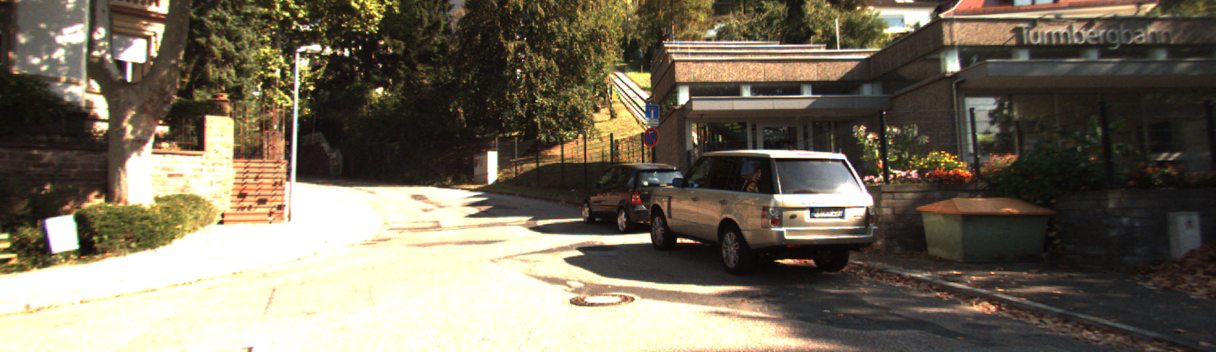
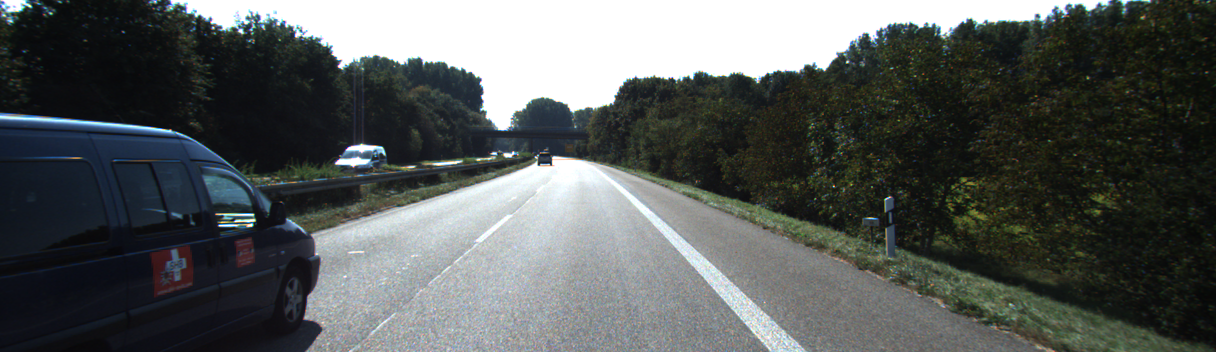
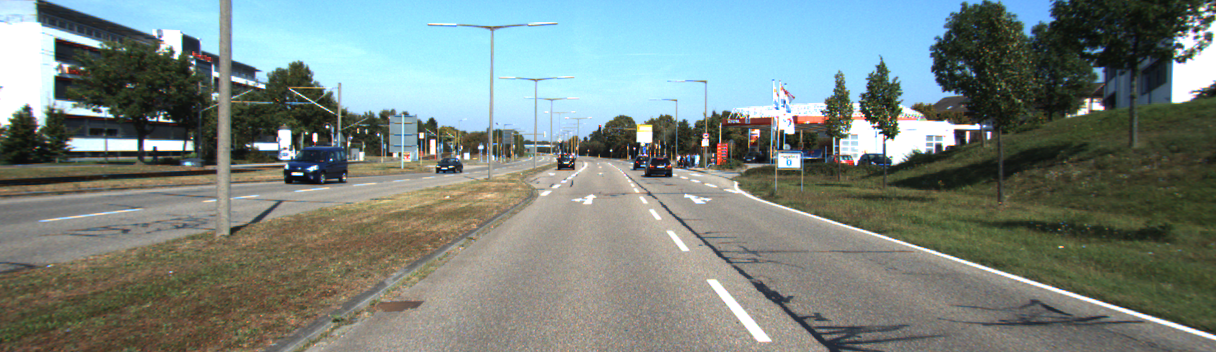
This page provides detailed results for the method(s) selected. For the first 20 test images, the percentage of erroneous pixels is depicted in the table. We use the error metric described in Sparsity Invariant CNNs (THREEDV 2017), which considers a pixel to be correctly estimated if the disparity or flow end-point error is <3px or <5% (for scene flow this criterion needs to be fulfilled for both disparity maps and the flow map). Underneath, the left input image, the estimated results and the error maps are shown (for disp_0/disp_1/flow/scene_flow, respectively). The error map uses the log-color scale described in Sparsity Invariant CNNs (THREEDV 2017), depicting correct estimates (<3px or <5% error) in blue and wrong estimates in red color tones. Dark regions in the error images denote the occluded pixels which fall outside the image boundaries. The false color maps of the results are scaled to the largest ground truth disparity values / flow magnitudes.
Test Set Average
|
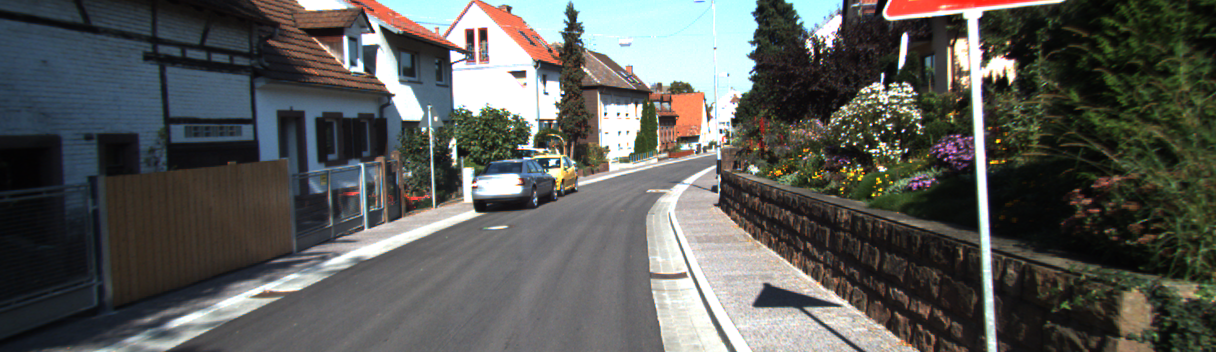
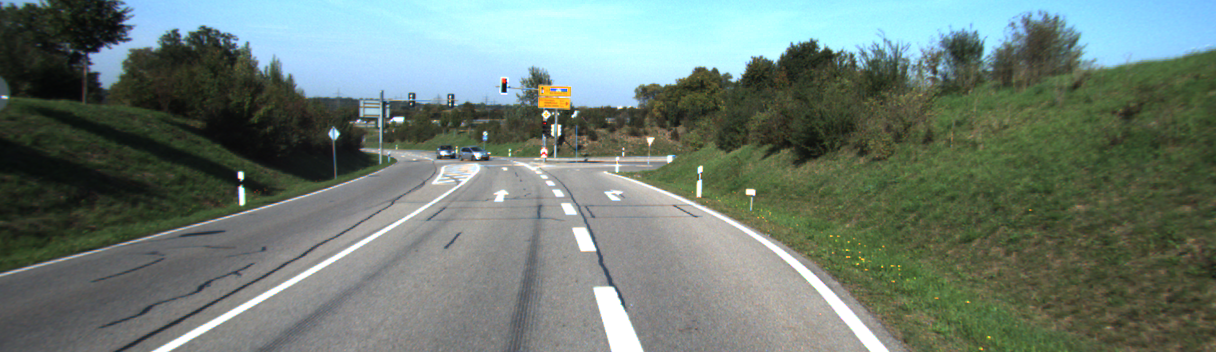
Test Image 0
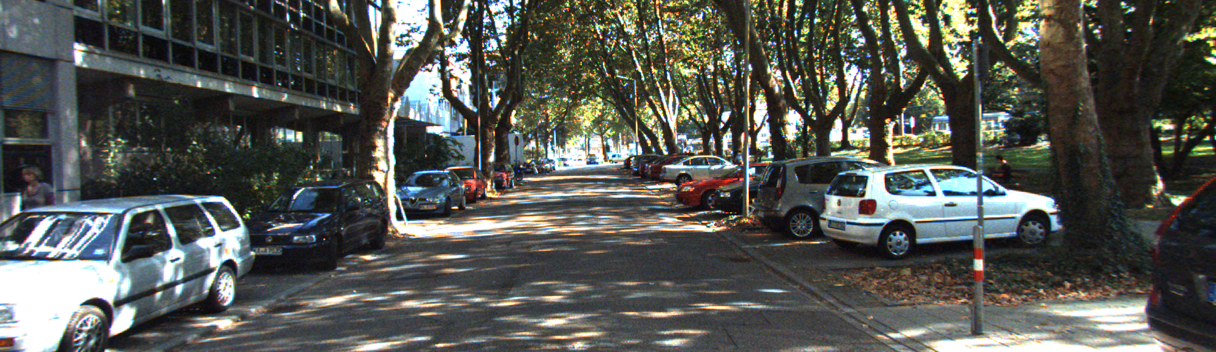 Input Image 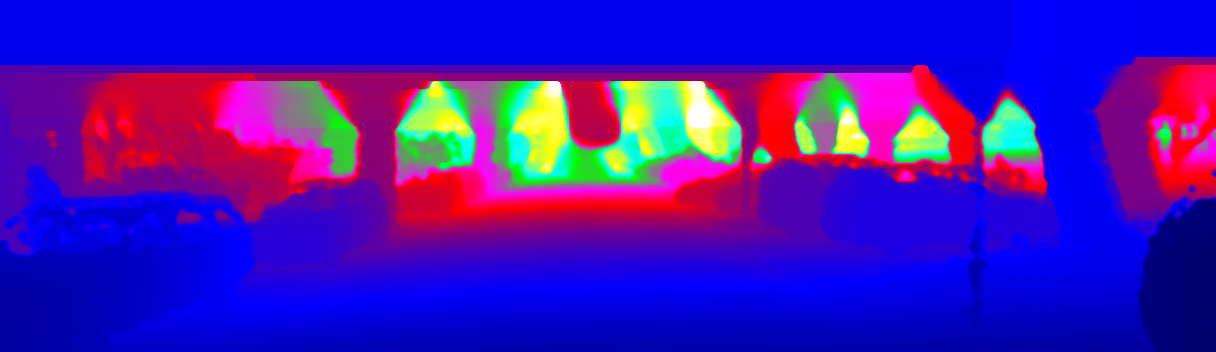 D1 Result 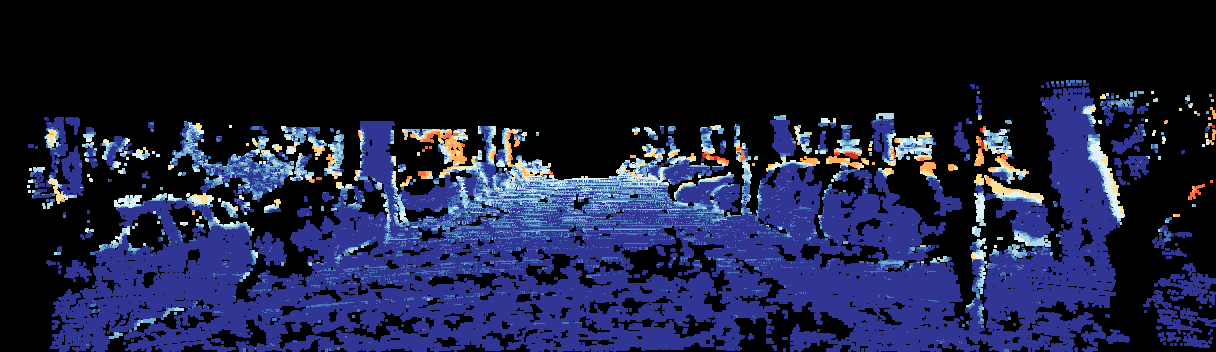 D1 Error |
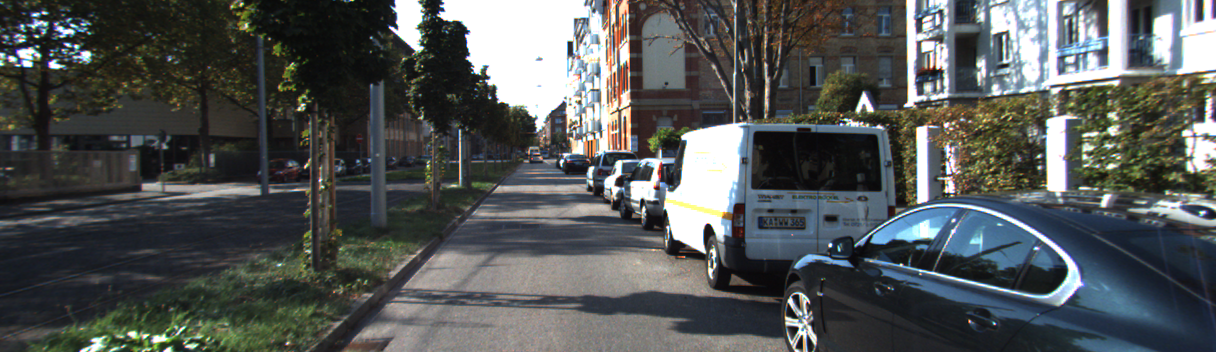
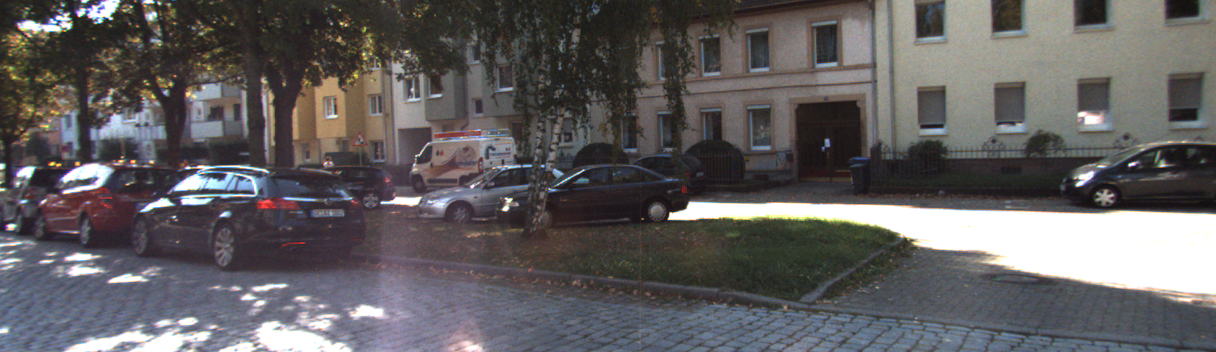
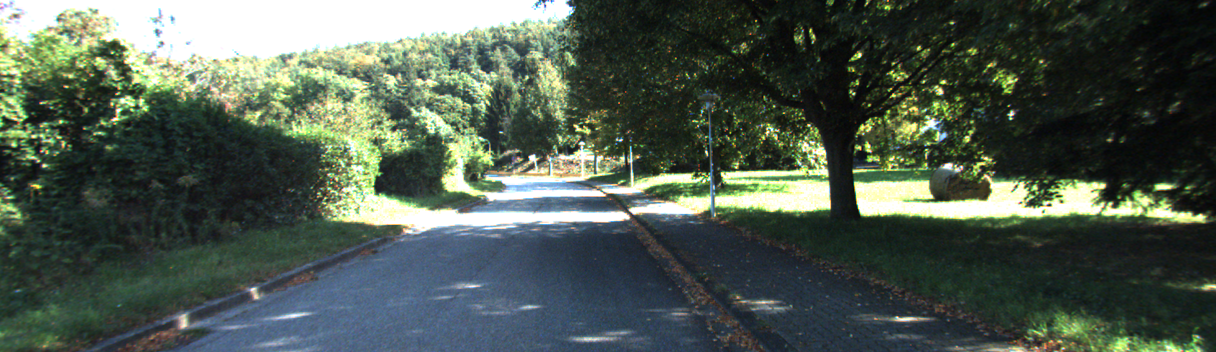
Test Image 1
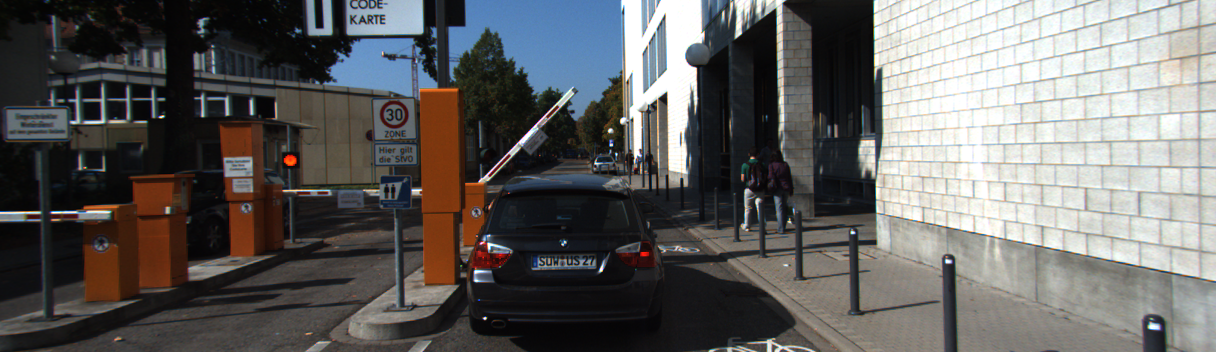 Input Image 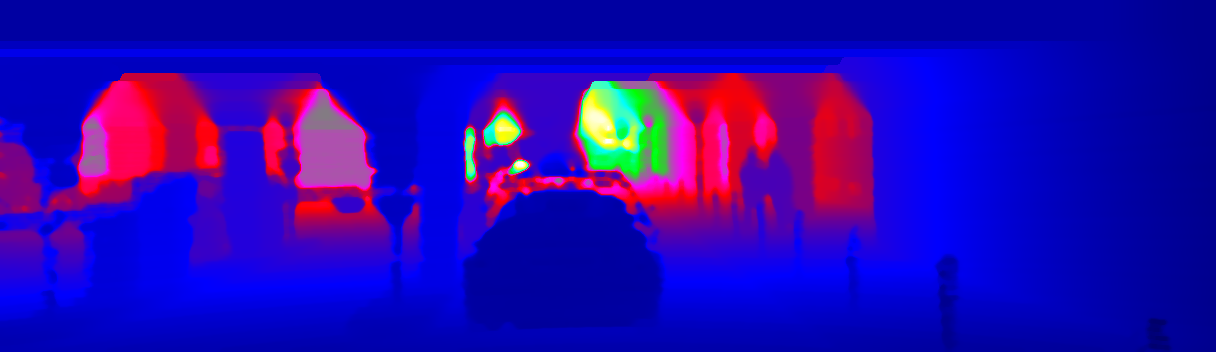 D1 Result 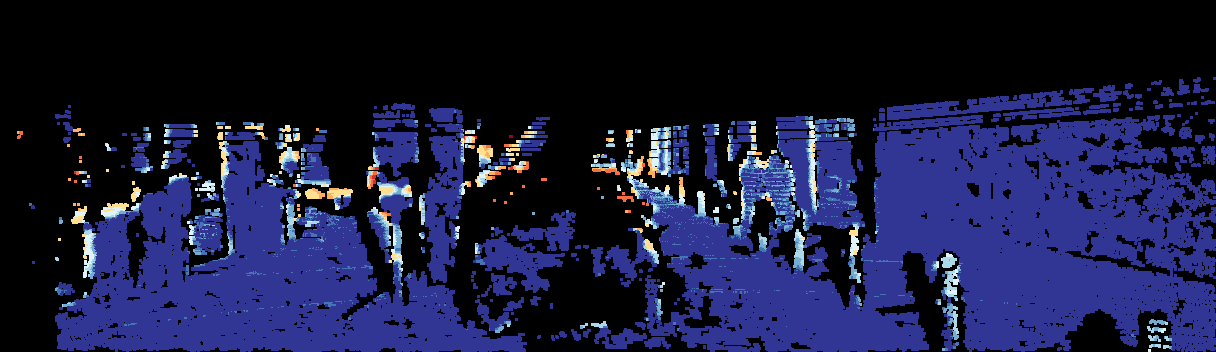 D1 Error |
Test Image 2
 Input Image 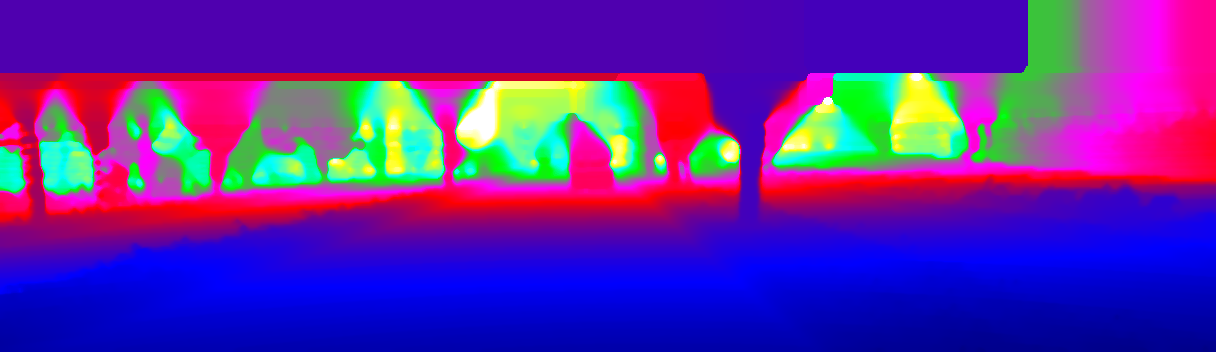 D1 Result 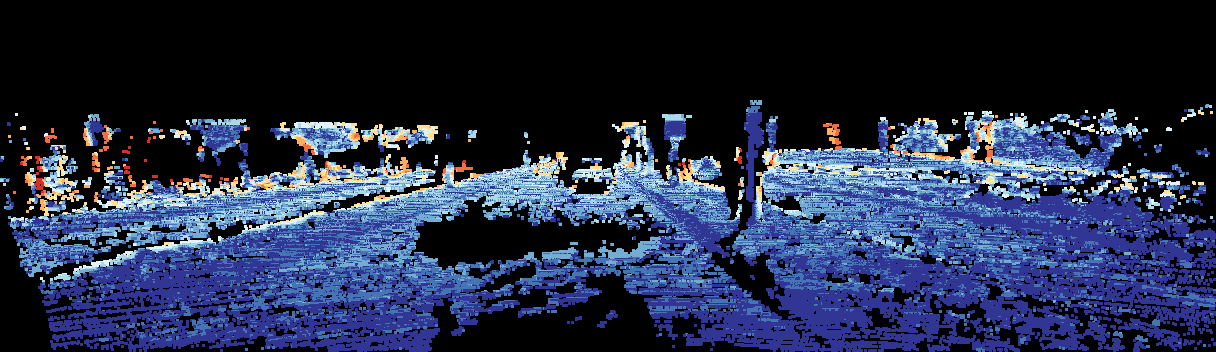 D1 Error |
Test Image 3
 Input Image 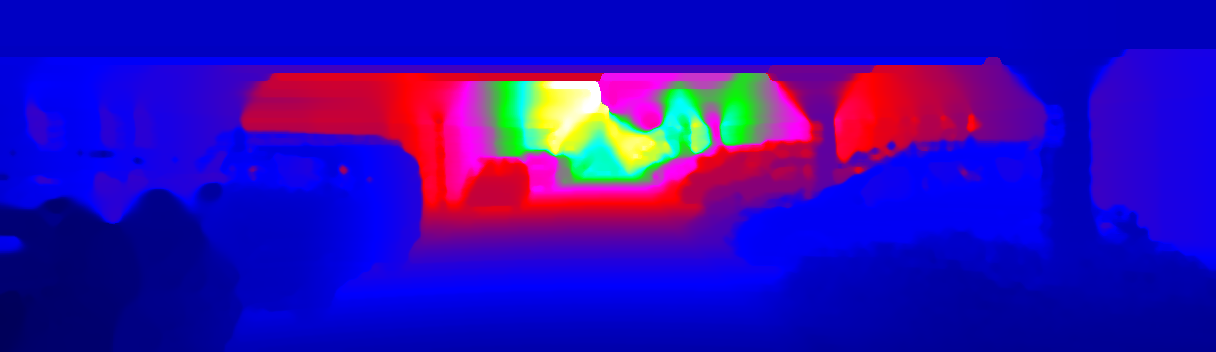 D1 Result 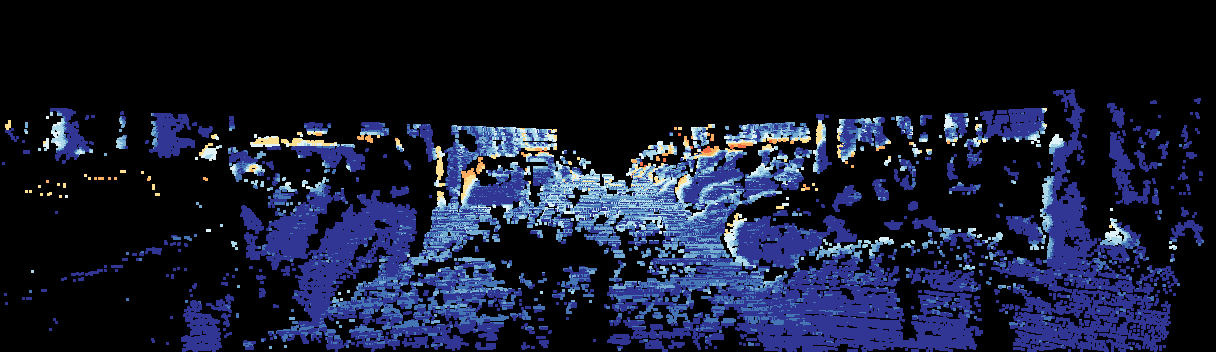 D1 Error |
Test Image 4
 Input Image 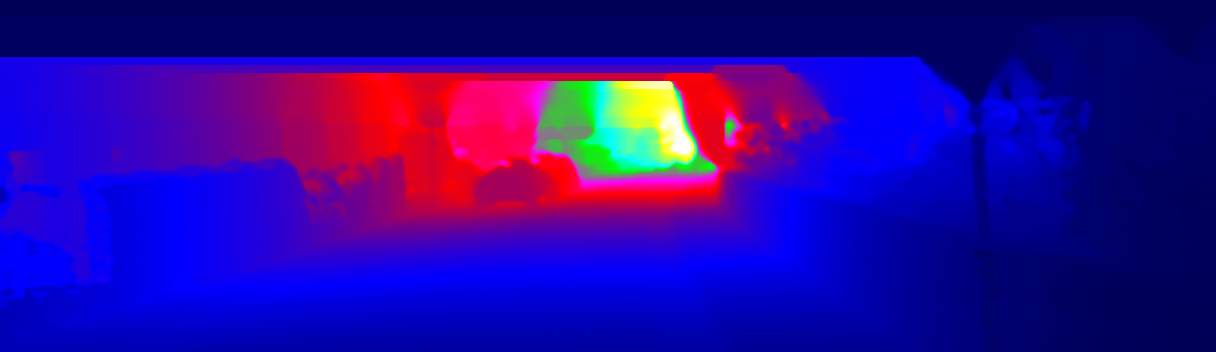 D1 Result 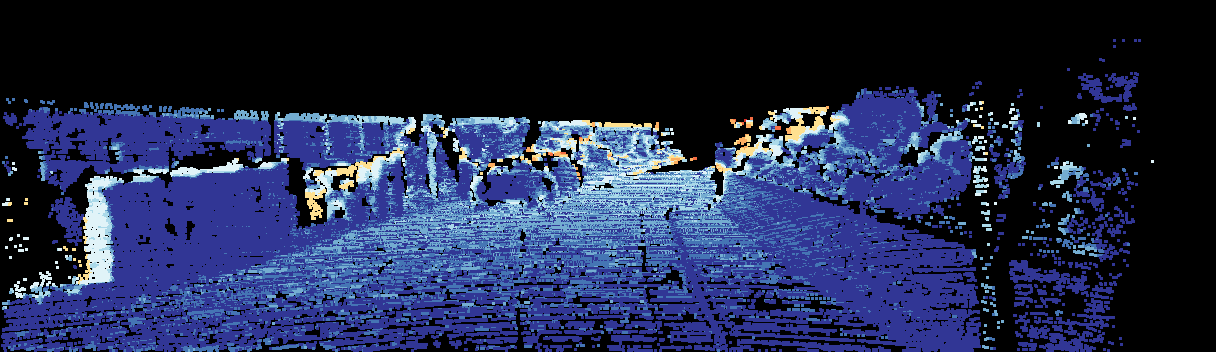 D1 Error |
Test Image 5
 Input Image 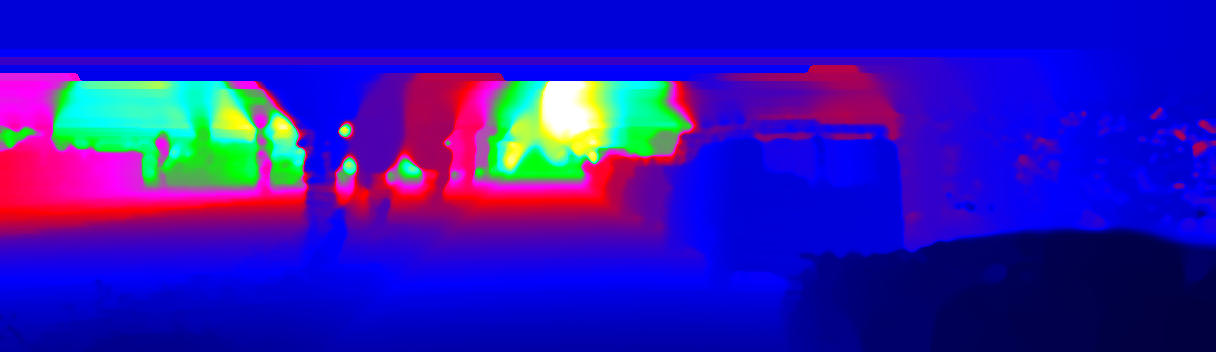 D1 Result 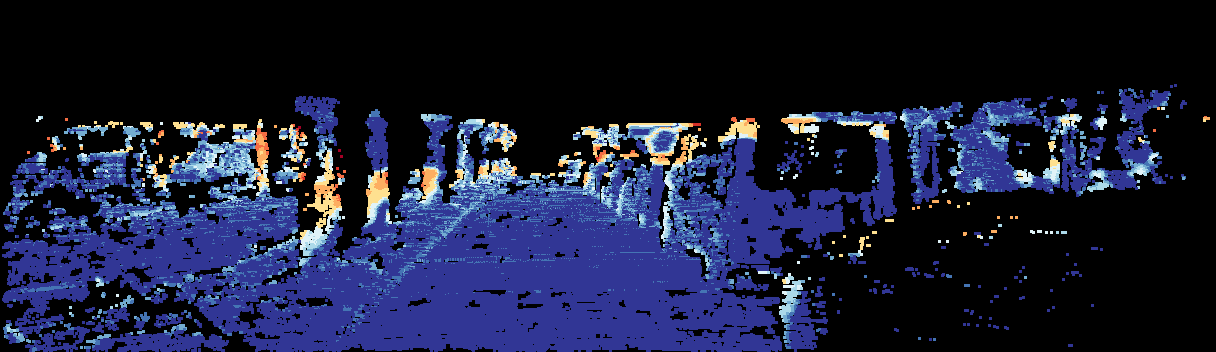 D1 Error |
Test Image 6
 Input Image 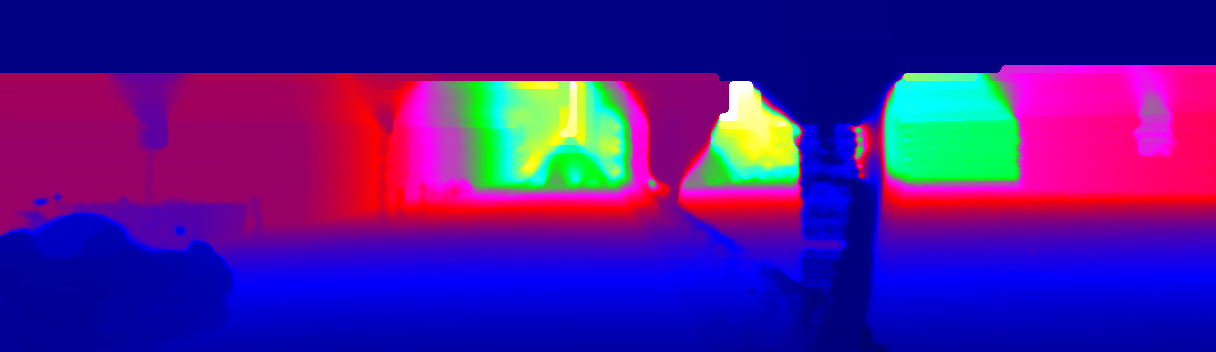 D1 Result 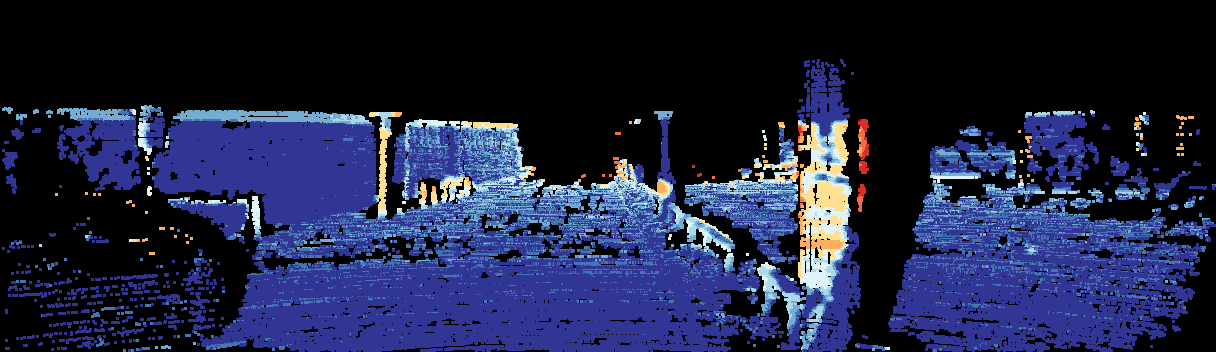 D1 Error |
Test Image 7
 Input Image 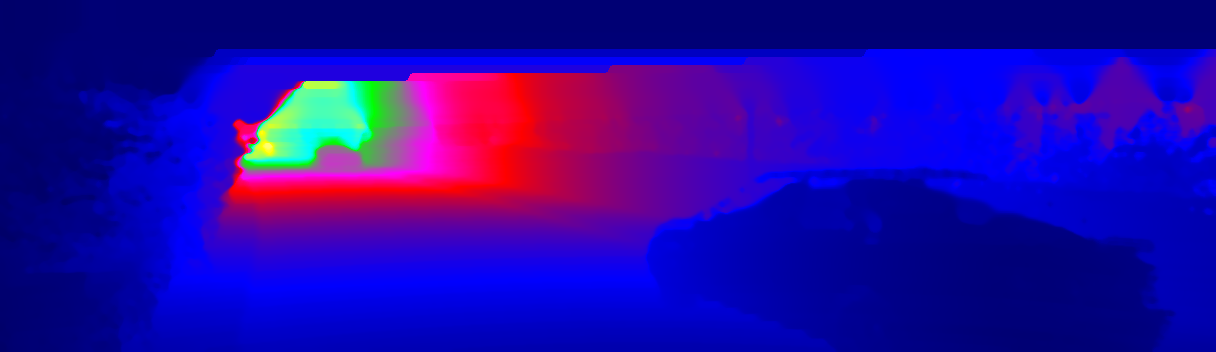 D1 Result 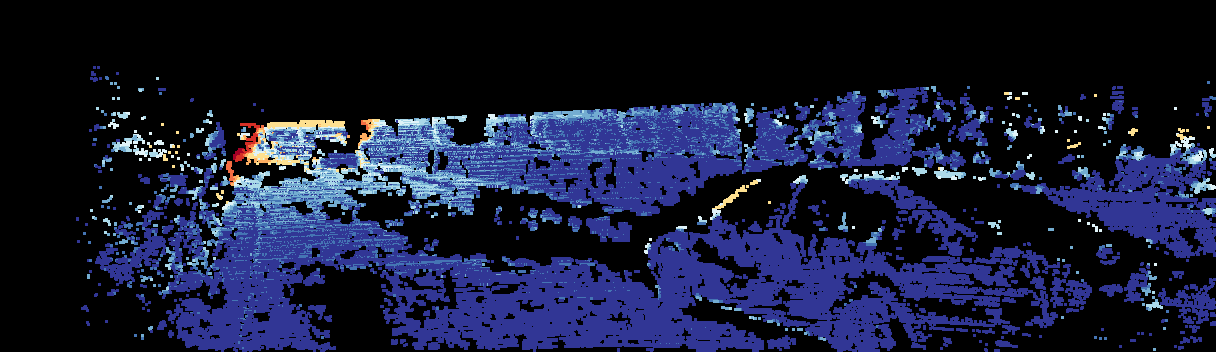 D1 Error |
Test Image 8
 Input Image 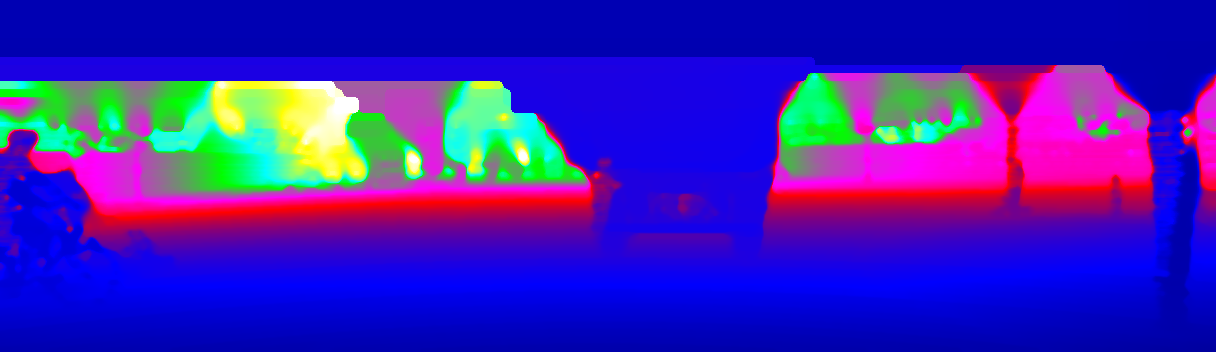 D1 Result 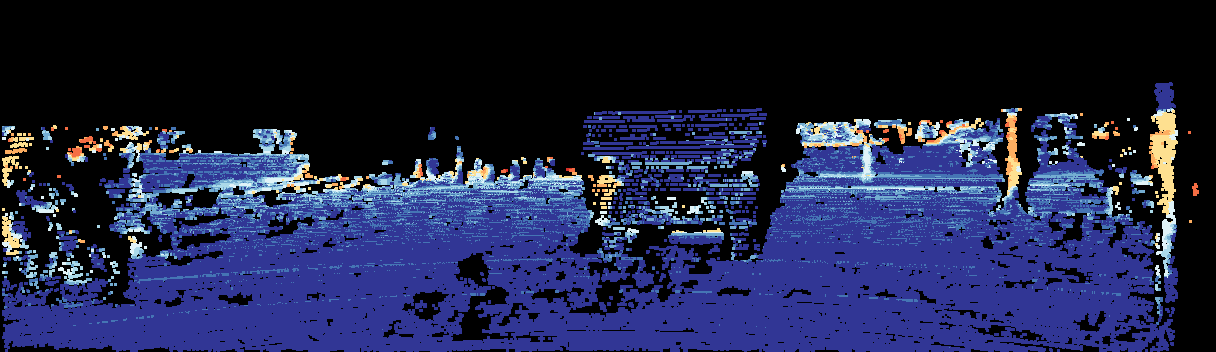 D1 Error |
Test Image 9
 Input Image 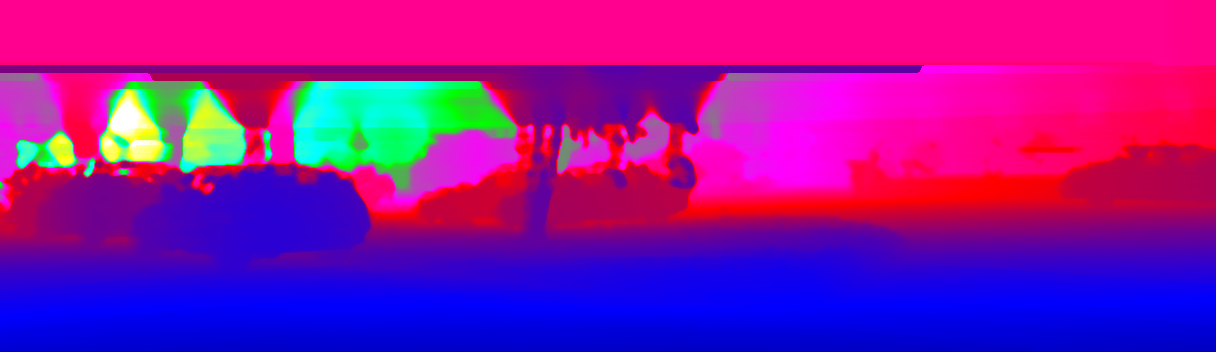 D1 Result 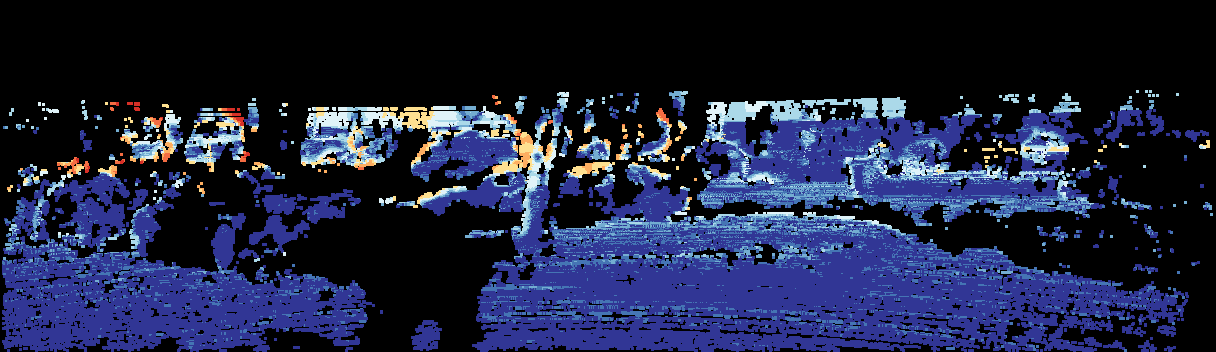 D1 Error |
Test Image 10
 Input Image 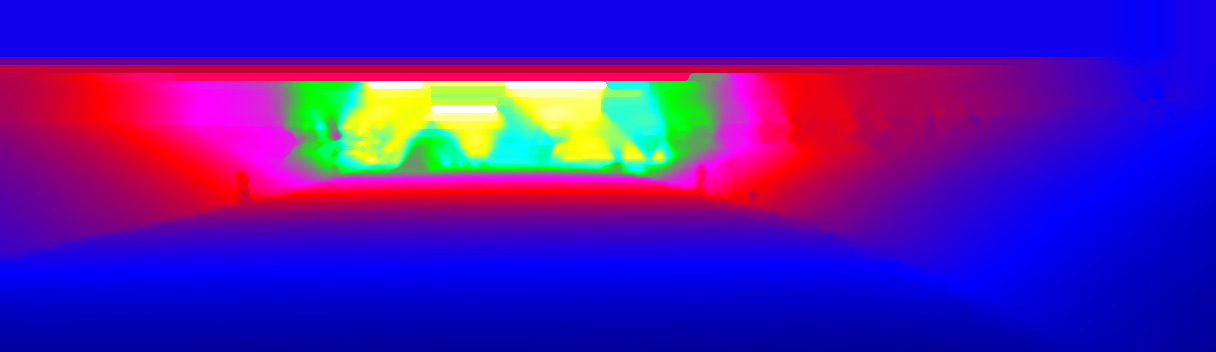 D1 Result 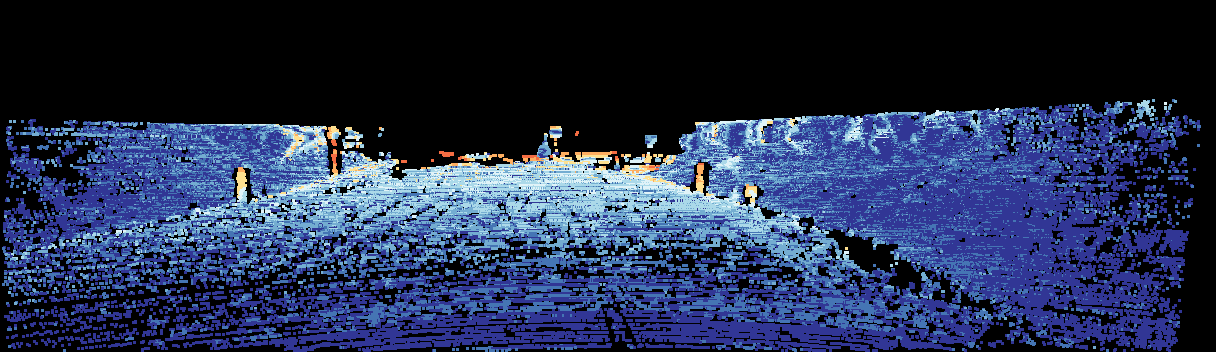 D1 Error |
Test Image 11
 Input Image 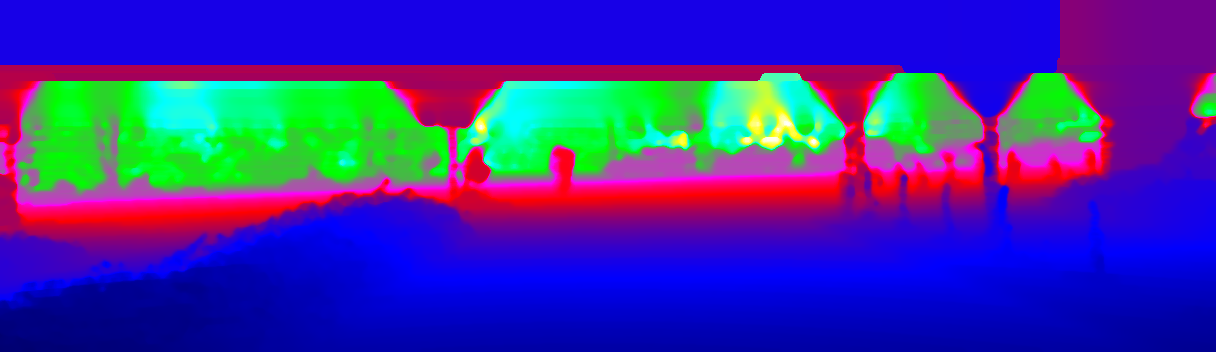 D1 Result 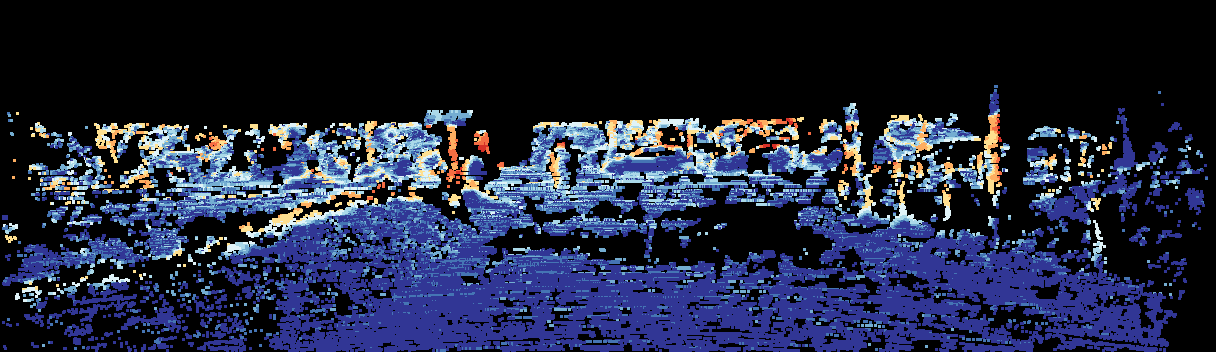 D1 Error |
Test Image 12
 Input Image 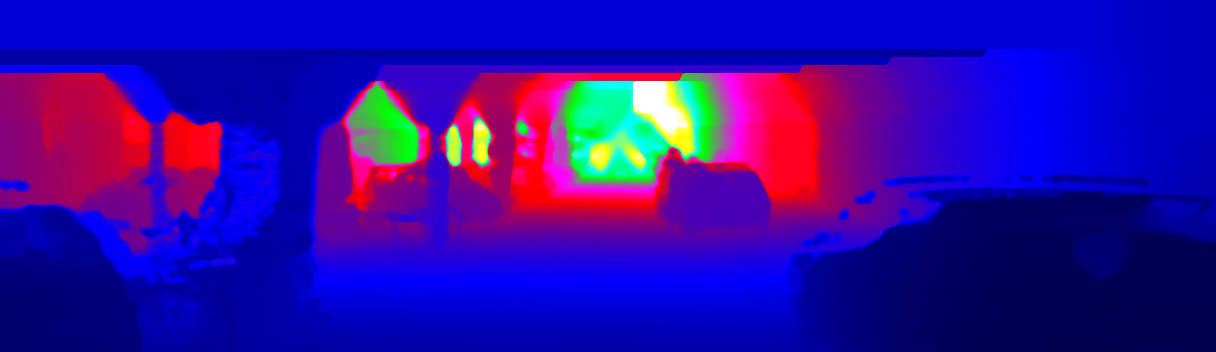 D1 Result 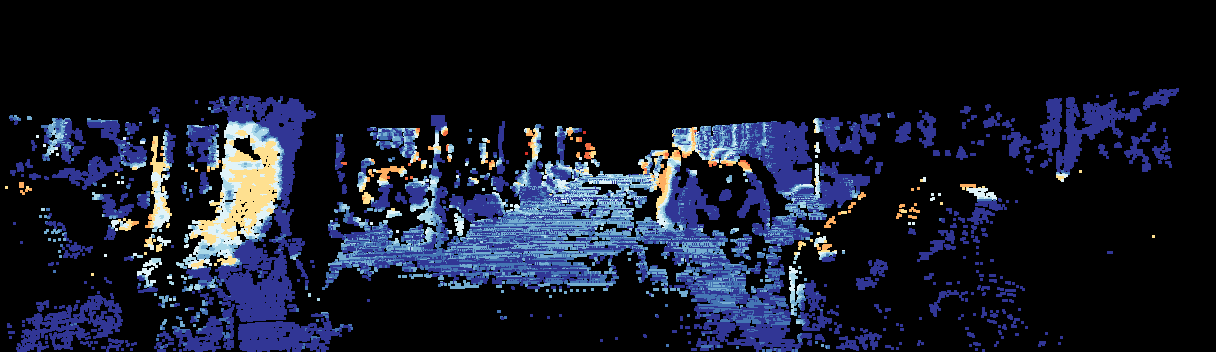 D1 Error |
Test Image 13
 Input Image 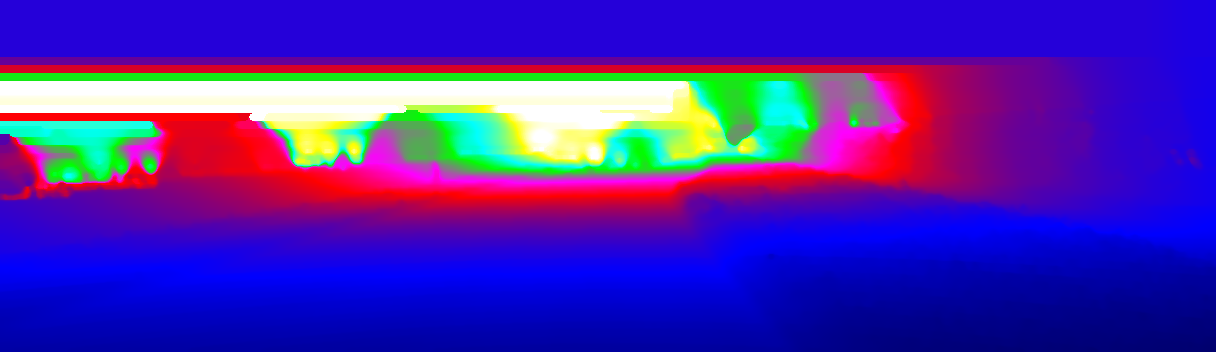 D1 Result 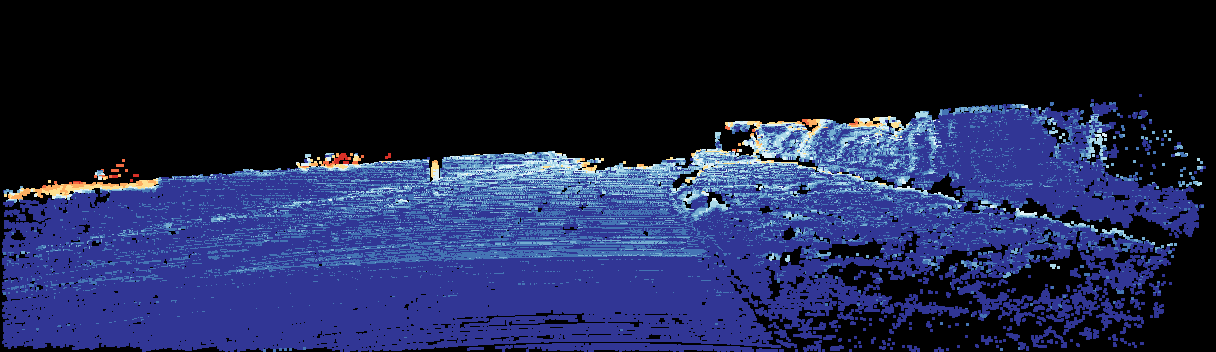 D1 Error |
Test Image 14
 Input Image 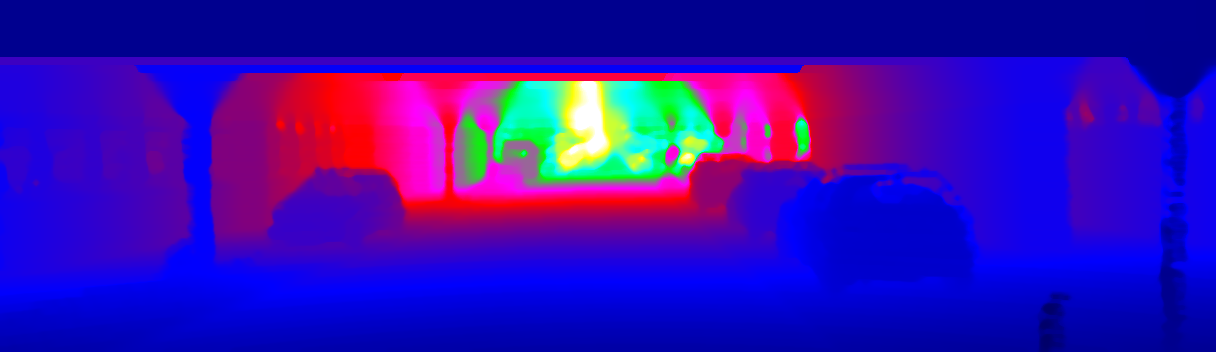 D1 Result 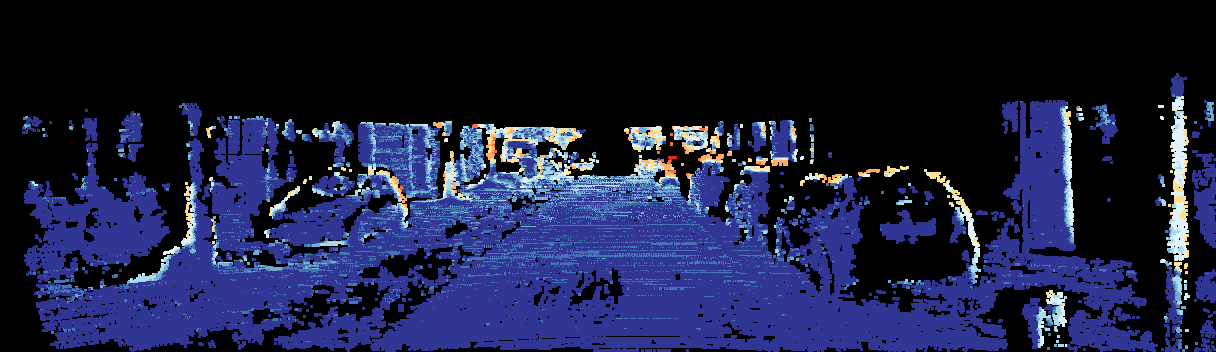 D1 Error |
Test Image 15
 Input Image 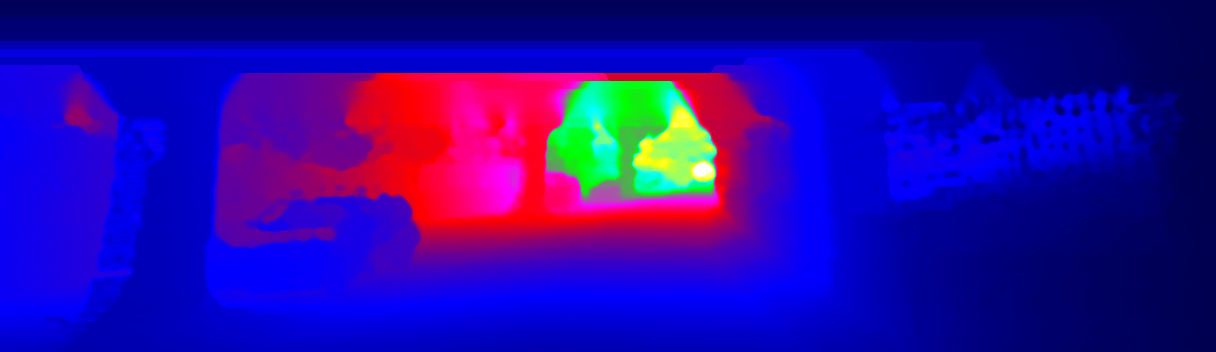 D1 Result 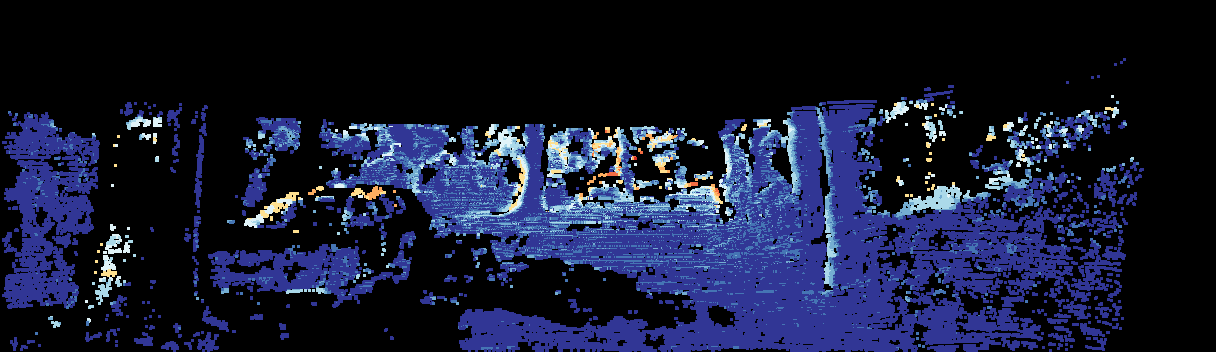 D1 Error |
Test Image 16
 Input Image 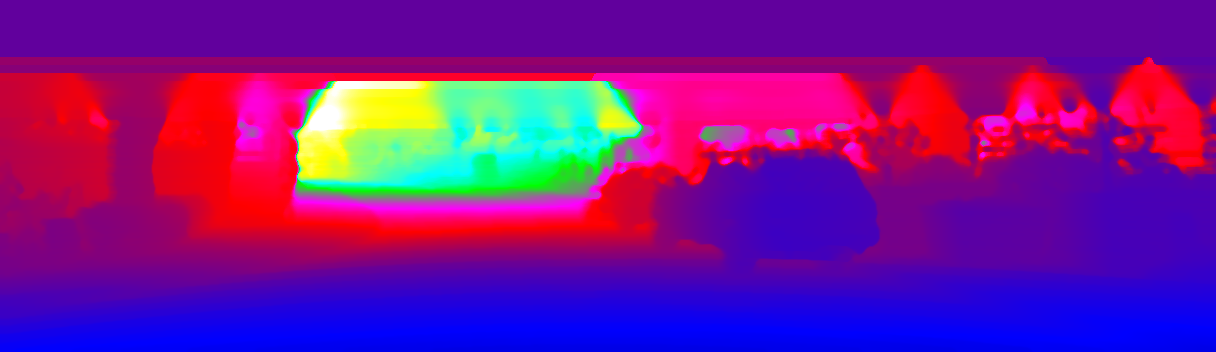 D1 Result 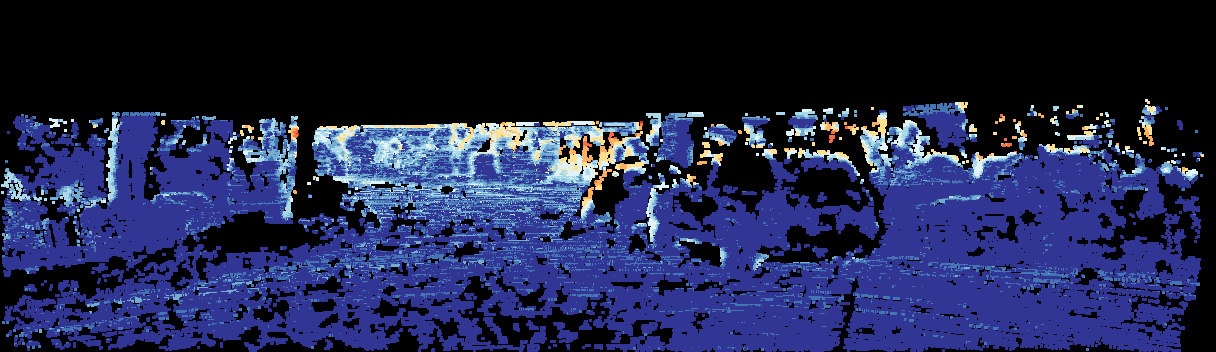 D1 Error |
Test Image 17
 Input Image 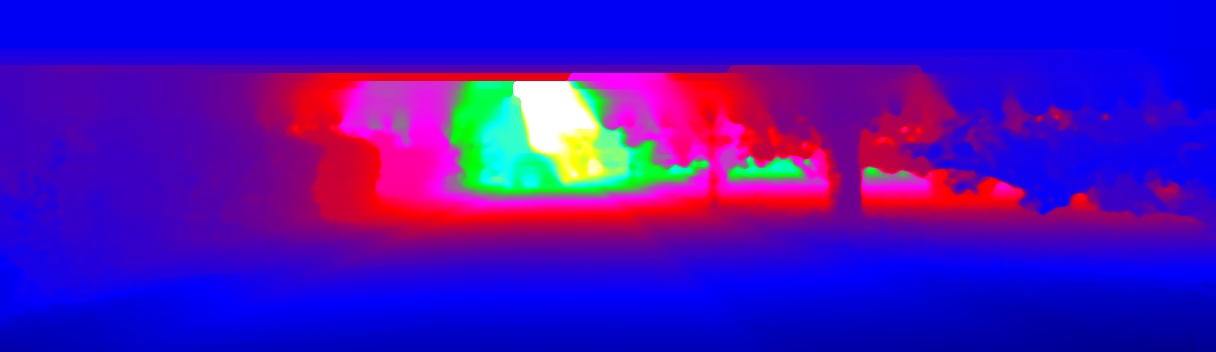 D1 Result 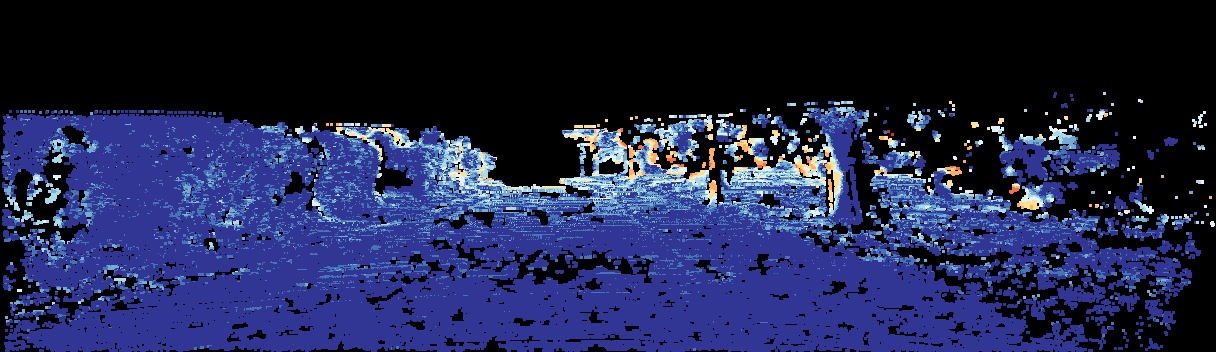 D1 Error |
Test Image 18
 Input Image 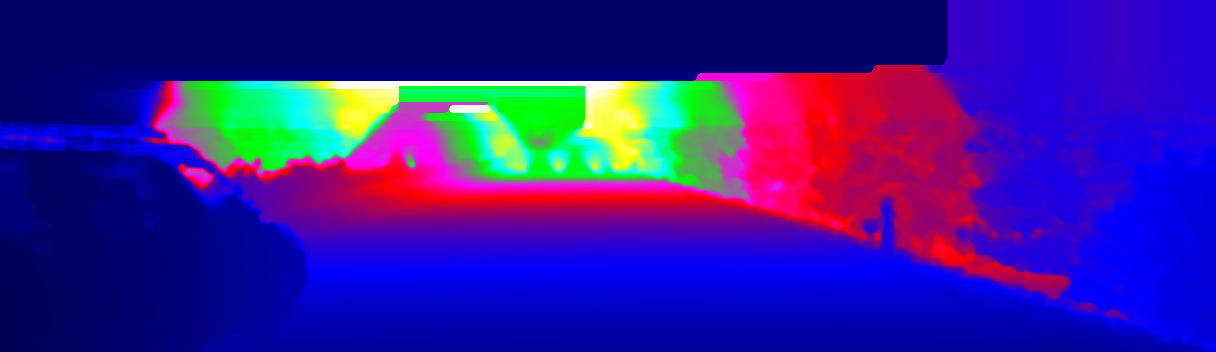 D1 Result 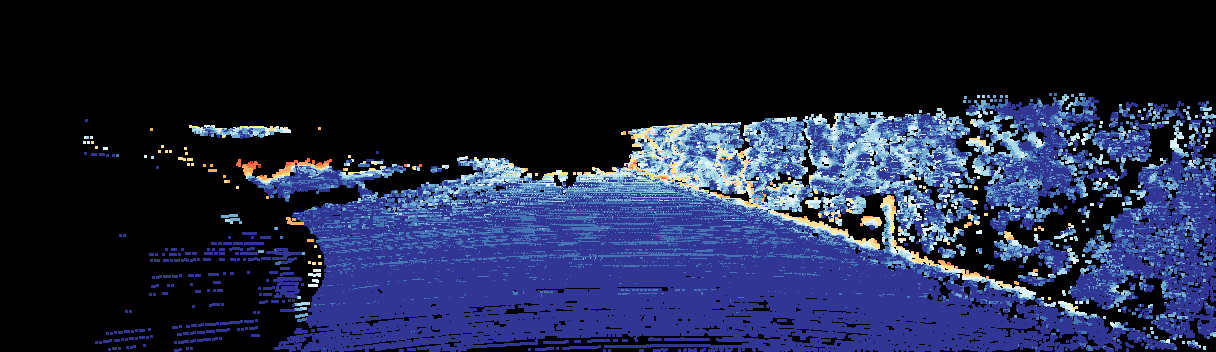 D1 Error |
Test Image 19
 Input Image 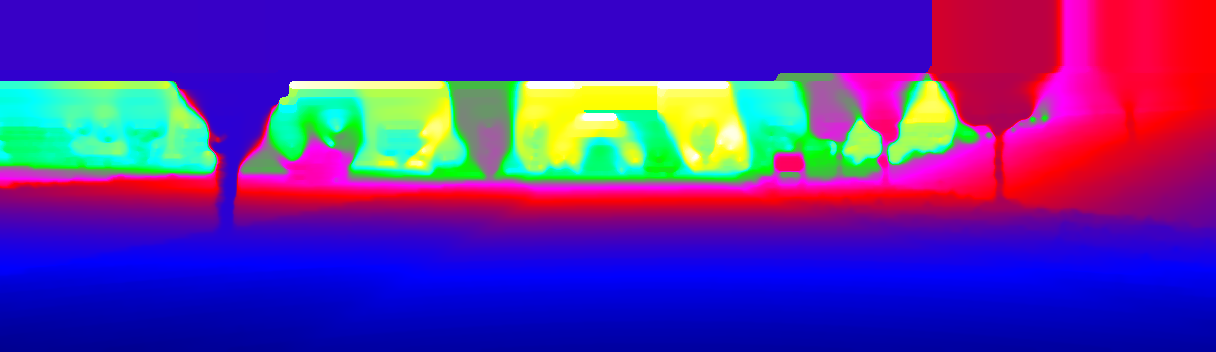 D1 Result 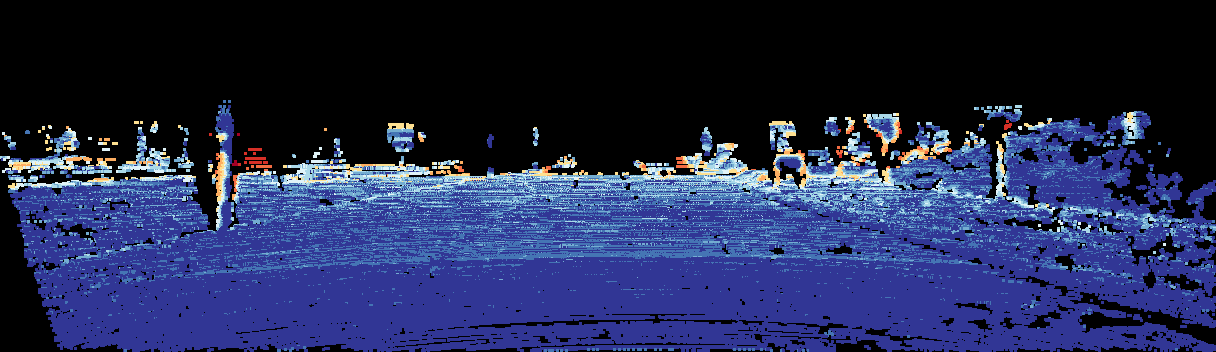 D1 Error |