Method

Road Estimation with Sparse 3D Points From Stereo [st] [RES3D-Stereo]


Submitted on 1 Jun. 2014 19:42 by
Patrick Shinzato (Mobile Robotic Laboratory, ICMC - USP)

Running time:0.7 s
Environment:1 core @ 2.5 Ghz (C/C++)

Method Description:
This is a novel obstacle detection method to stereo cameras that uses only few pixels from entire image. The main idea is detect obstacle points using the local spatial-relationship presented by RES3D-Velo in the \textbf{UVD} space. After the obstacle detection step, polar histograms are used to generate a confidence map that represents the estimated road area in the image.
Parameters:
\lambda = 5 pixels\\
\alpha = 0.98\\
\theta = 11.7^{\circ}\\
disp\_max = 70\\
dist\_max = 150\\
H = 63\\
\Omega = [ 0.100, 0.125, 0.150, 0.175, 0.200, 0.225, 0.250 ]\\
\kappa = [ (ox-100, oy),(ox-75, oy),(ox-50, oy),(ox-25, oy),\\
(ox, oy),(ox+25, oy),(ox+50, oy),(ox+75, oy),\\
(ox+100, oy)], where: \\
ox = width/2\\
oy = height-20\\
Latex Bibtex:
@INPROCEEDINGS{Shinzato2014ITSC,
author={P. Y. Shinzato and D. Gomes and D. F. Wolf},
booktitle={Intelligent Transportation Systems (ITSC), 2014 IEEE 17th International Conference on},
title={Road estimation with sparse 3D points from stereo data},
year={2014},
pages={1688-1693},
keywords={automobiles;collision avoidance;control engineering computing;driver information systems;image sensors;road traffic control;stereo image processing;ADAS;adaptive cruise controls;advanced driver assistance systems;collision warning systems;disparity maps;fast obstacle estimation;obstacle detection;risky situation;robust road estimation method;self-driving cars;sparse 3D points;standard ROAD-KITTI benchmark;stereo cameras;stereo data;Benchmark testing;Estimation;Histograms;Image edge detection;Mathematical model;Roads;Training},
doi={10.1109/ITSC.2014.6957936},
month={Oct},}

Evaluation in Bird's Eye View


Benchmark MaxF AP PRE REC FPR FNR
UM_ROAD 78.98 % 80.06 % 75.94 % 82.27 % 11.88 % 17.73 %
UMM_ROAD 83.62 % 85.74 % 79.81 % 87.81 % 24.42 % 12.19 %
UU_ROAD 78.75 % 73.60 % 77.63 % 79.90 % 7.50 % 20.10 %
URBAN_ROAD 81.08 % 81.68 % 78.14 % 84.24 % 12.98 % 15.76 %
This table as LaTeX

Behavior Evaluation


Benchmark PRE-20 F1-20 HR-20 PRE-30 F1-30 HR-30 PRE-40 F1-40 HR-40
This table as LaTeX

Road/Lane Detection

The following plots show precision/recall curves for the bird's eye view evaluation.


This figure as: png eps pdf

This figure as: png eps pdf

This figure as: png eps pdf

This figure as: png eps pdf

Distance-dependent Behavior Evaluation

The following plots show the F1 score/Precision/Hitrate with respect to the longitudinal distance which has been used for evaluation.


Visualization of Results

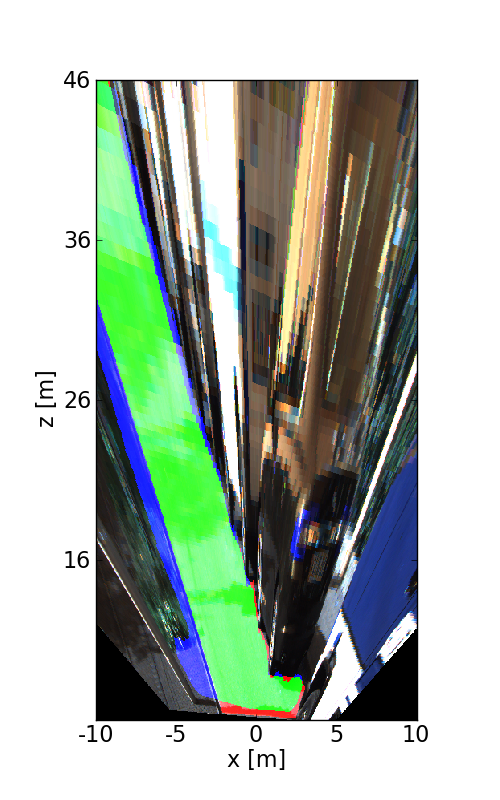
The following images illustrate the performance of the method qualitatively on a couple of test images. We first show results in the perspective image, followed by evaluation in bird's eye view. Here, red denotes false negatives, blue areas correspond to false positives and green represents true positives.


This figure as: png

This figure as: png

This figure as: png

This figure as: png

This figure as: png

This figure as: png

This figure as: png

This figure as: png

This figure as: png

This figure as: png

This figure as: png

This figure as: png

This figure as: png

This figure as: png

This figure as: png

This figure as: png

This figure as: png

This figure as: png


eXTReMe Tracker