Method

Multi-Modal Multi-Task (3MT) Road Segmentation [la] [gp] [3MT-RoadSeg]
https://github.com/ErkanMilli/3MT-RoadSeg

Submitted on 25 Aug. 2024 20:54 by
Erkan Milli (Ankara University)

Running time:0.07 s
Environment:GPU @ 2.5 Ghz (Python)

Method Description:
This study presents a cost-effective and highly
accurate solution for road segmentation by
integrating data from multiple sensors within a
multi-task learning architecture. A fusion
architecture is proposed in which RGB and LiDAR
depth images constitute the inputs of the network.
Another contribution of this study is to use
IMU/GNSS (inertial measurement unit/global
navigation satellite system) inertial navigation
system whose data is collected synchronously and
calibrated with a LiDAR-camera to compute
aggregated dense LiDAR depth images.
Parameters:
Adam optimizer with a learning rate of 1e-4
Latex Bibtex:
@ARTICLE{10182336,
author={Milli, Erkan and Erkent, Özgür and
Yılmaz, Asım Egemen},
journal={IEEE Robotics and Automation Letters},
title={Multi-Modal Multi-Task (3MT) Road
Segmentation},
year={2023},
volume={8},
number={9},
pages={5408-5415},
keywords={Laser radar;Task
analysis;Roads;Computer architecture;Robot sensing
systems;Point cloud
compression;Multitasking;multi-task learning;road
segmentation;sensor fusion},
doi={10.1109/LRA.2023.3295254}}

Evaluation in Bird's Eye View


Benchmark MaxF AP PRE REC FPR FNR
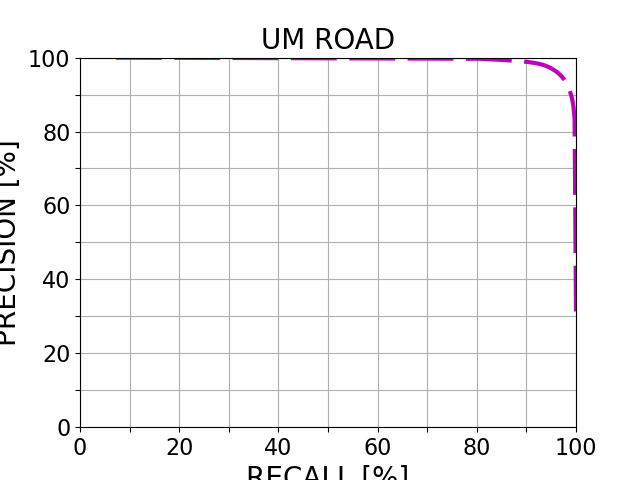
UM_ROAD 96.13 % 93.42 % 96.20 % 96.06 % 1.73 % 3.94 %
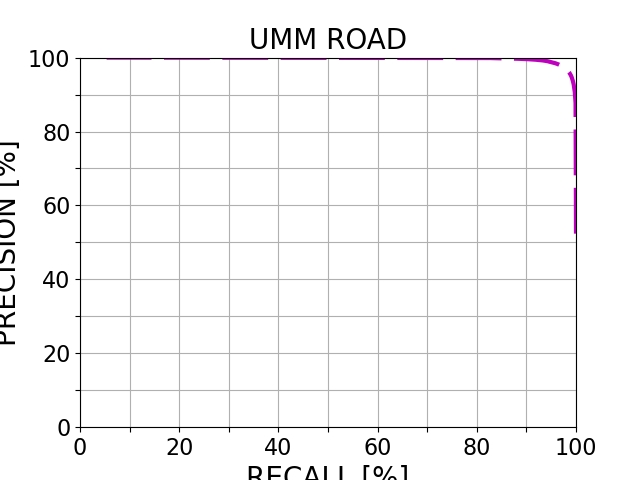
UMM_ROAD 97.46 % 95.54 % 97.30 % 97.62 % 2.97 % 2.38 %
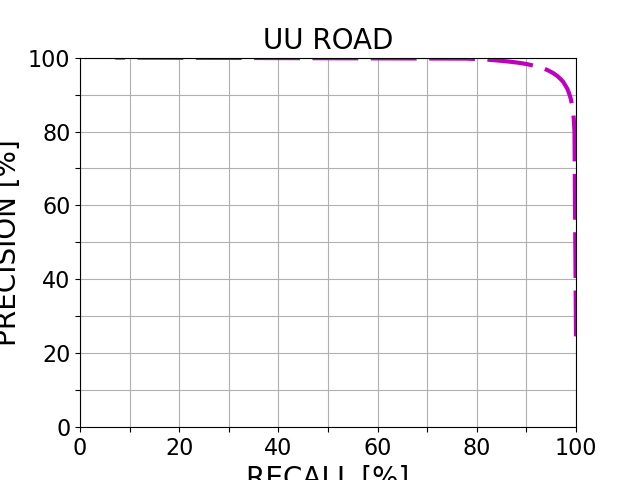
UU_ROAD 95.63 % 92.77 % 95.37 % 95.89 % 1.52 % 4.11 %
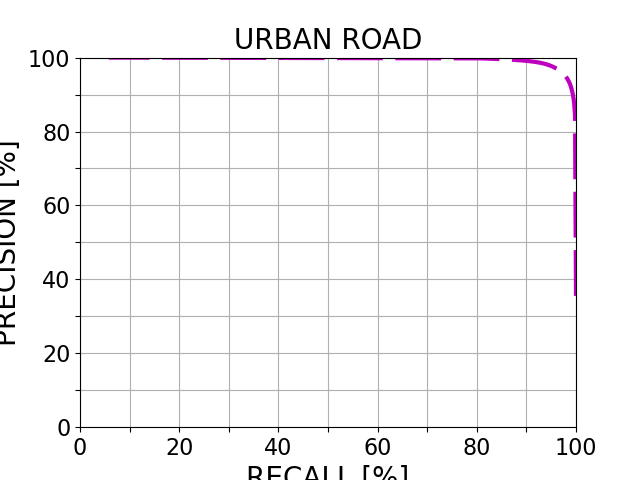
URBAN_ROAD 96.60 % 93.90 % 96.46 % 96.73 % 1.95 % 3.27 %
This table as LaTeX

Behavior Evaluation


Benchmark PRE-20 F1-20 HR-20 PRE-30 F1-30 HR-30 PRE-40 F1-40 HR-40
This table as LaTeX

Road/Lane Detection

The following plots show precision/recall curves for the bird's eye view evaluation.


This figure as: png eps pdf

This figure as: png eps pdf

This figure as: png eps pdf

This figure as: png eps pdf

Distance-dependent Behavior Evaluation

The following plots show the F1 score/Precision/Hitrate with respect to the longitudinal distance which has been used for evaluation.


Visualization of Results

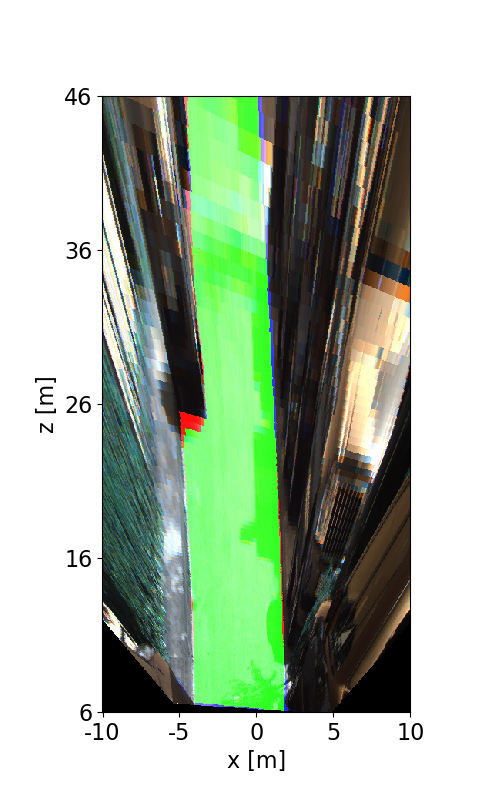
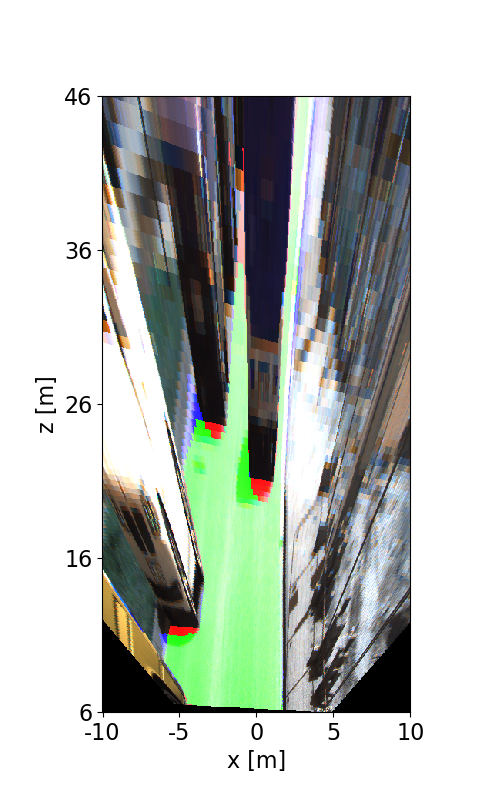
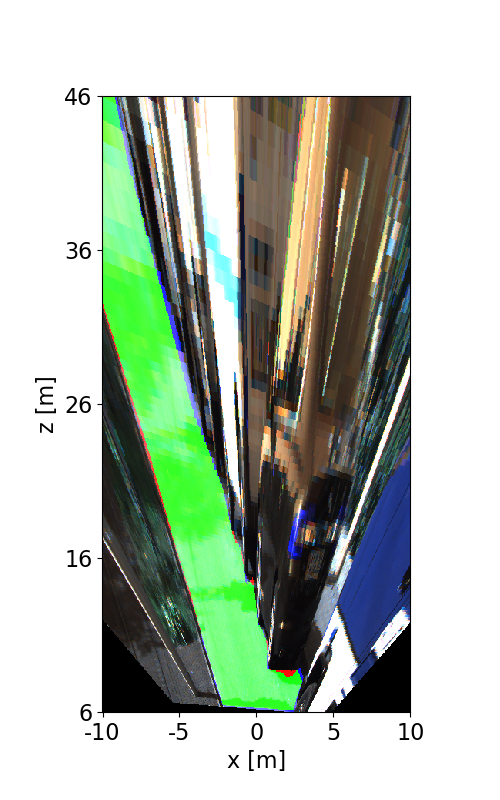
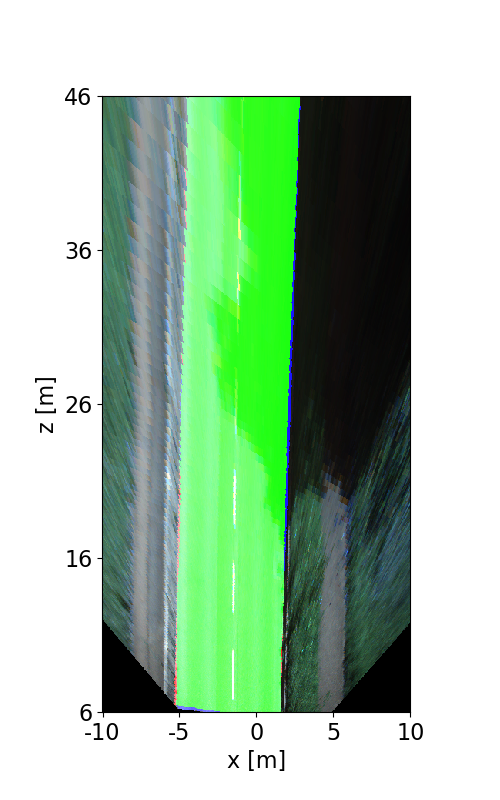
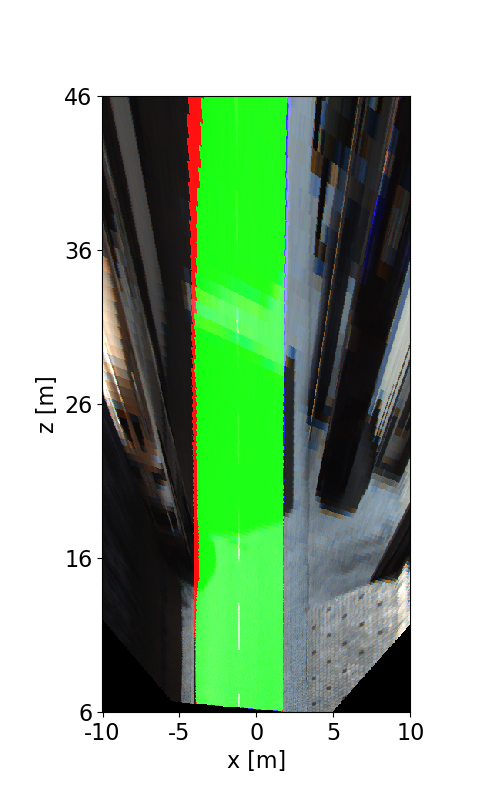
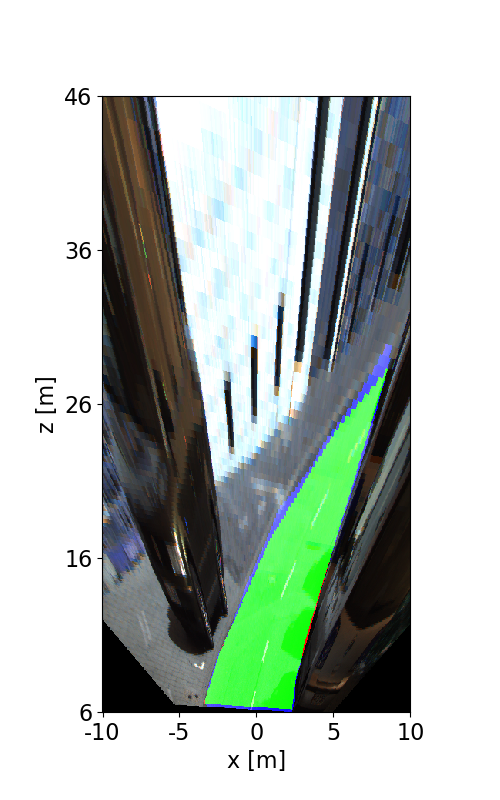
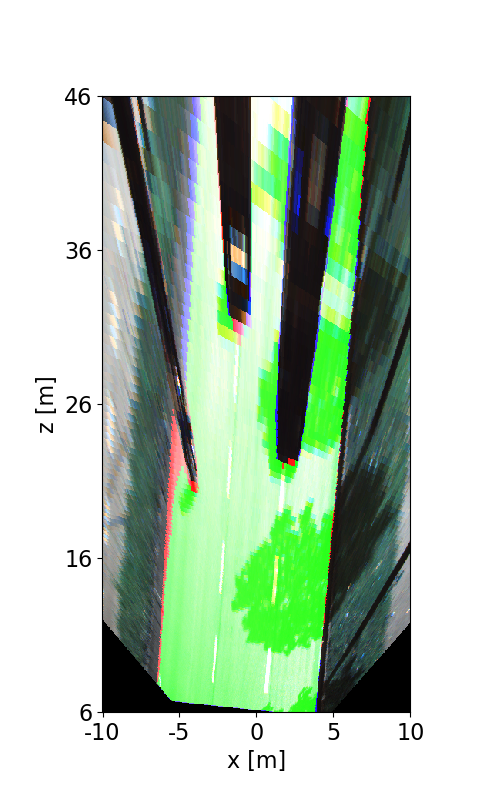
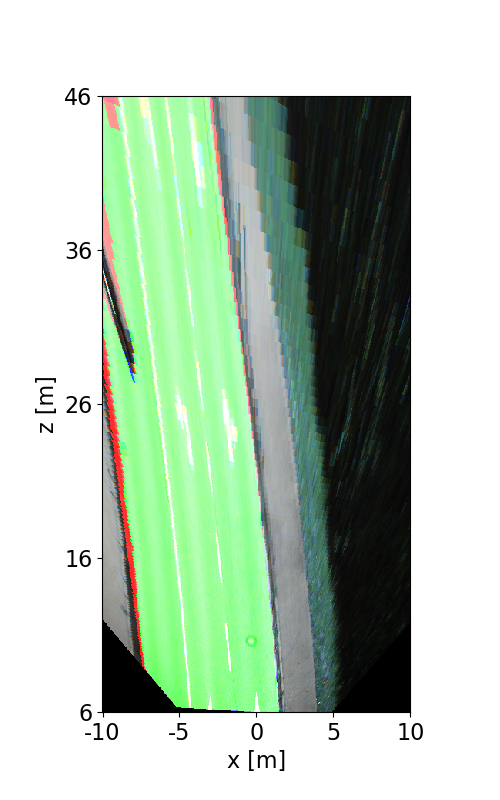
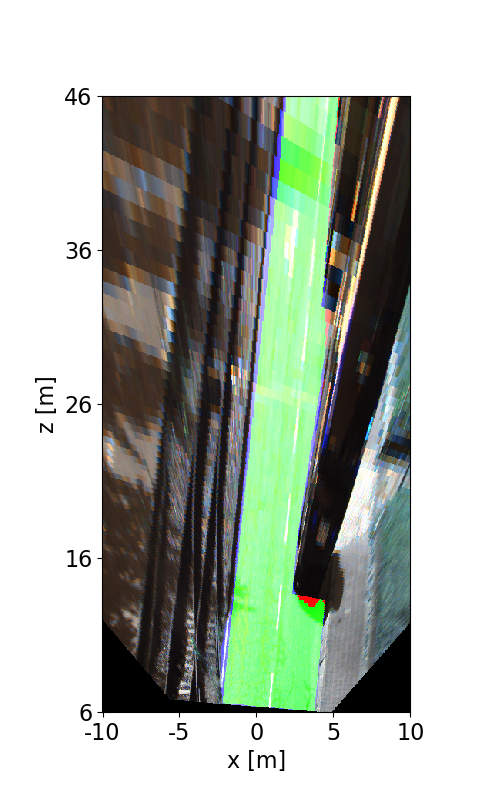
The following images illustrate the performance of the method qualitatively on a couple of test images. We first show results in the perspective image, followed by evaluation in bird's eye view. Here, red denotes false negatives, blue areas correspond to false positives and green represents true positives.


This figure as: png

This figure as: png

This figure as: png

This figure as: png

This figure as: png

This figure as: png

This figure as: png

This figure as: png

This figure as: png

This figure as: png

This figure as: png

This figure as: png

This figure as: png

This figure as: png

This figure as: png

This figure as: png

This figure as: png

This figure as: png


eXTReMe Tracker