Method

Evidence-based Real-time Road Segmentation with RGB-D Data Augmentation [Evi-RoadSeg]
https://github.com/xuefeng-cvr/Evi-RoadSeg

Submitted on 20 Nov. 2024 16:01 by
feng xue (bupt)

Running time:0.01 s
Environment:GPU @ 2.5 Ghz (Python)

Method Description:
RGB and depth data in road scenes are sensitive to
different regions respectively, but current RGB-D
based road segmentation methods generally combine
features within sensitive regions which preserving
false road representation from one of the data.
Based on such findings, we design an Evidence-
based Road Segmentation Method (Evi-RoadSeg),
which incorporates prior knowledge of the modal-
specific characteristics.
Parameters:
\tau_1=0.3
\tau_2=0.8
\rho=\{1,2,4,6\}
Latex Bibtex:
@article{tits_eviroadseg,
title = {Evidence-based Real-time Road
Segmentation with RGB-D Data Augmentation},
author = {Xue✝, Feng and Chang✝, Yicong and Xu,
Wenzhuang and Liang, Wenteng and Sheng, Fei and
Ming, Anlong},
journal = {Transactions on Intelligent
Transportation Systems (T-ITS)},
year = {2024},
volume = {},
number = {},
pages = {},
xdoi = {},
}

Evaluation in Bird's Eye View


Benchmark MaxF AP PRE REC FPR FNR
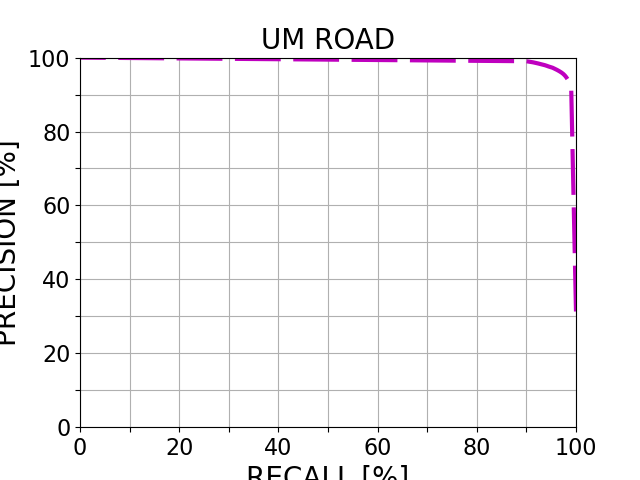
UM_ROAD 96.51 % 92.94 % 95.90 % 97.13 % 1.89 % 2.87 %
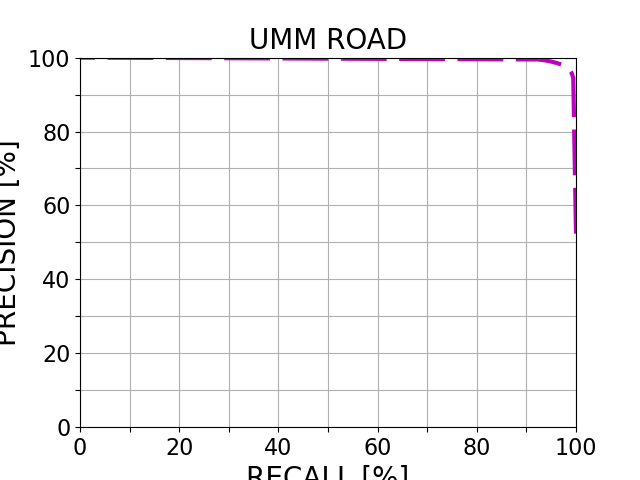
UMM_ROAD 97.80 % 95.25 % 97.50 % 98.10 % 2.77 % 1.90 %
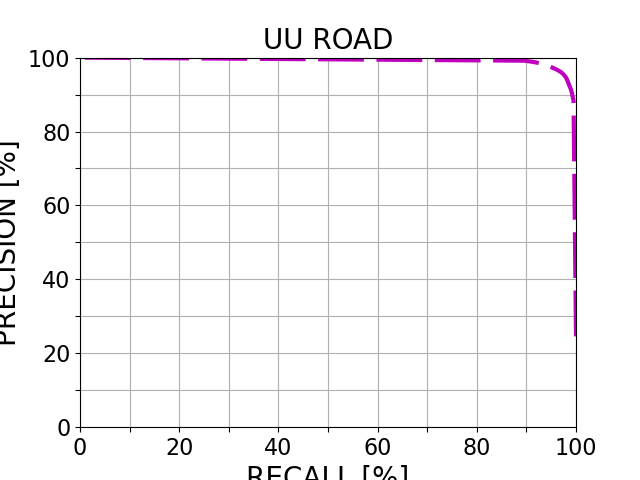
UU_ROAD 96.52 % 92.43 % 95.94 % 97.10 % 1.34 % 2.90 %
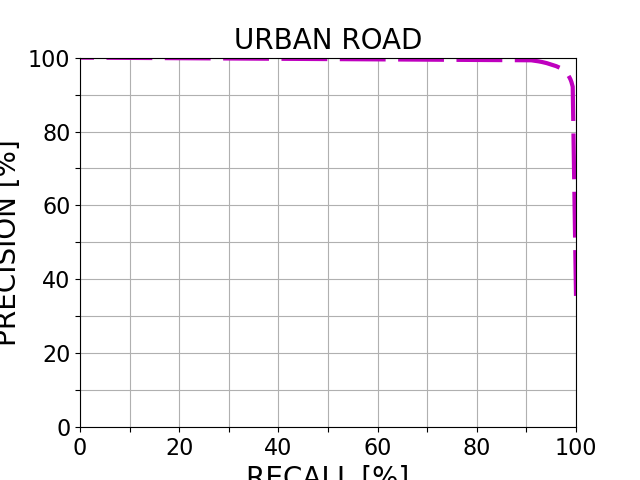
URBAN_ROAD 97.08 % 93.54 % 96.57 % 97.59 % 1.91 % 2.41 %
This table as LaTeX

Behavior Evaluation


Benchmark PRE-20 F1-20 HR-20 PRE-30 F1-30 HR-30 PRE-40 F1-40 HR-40
This table as LaTeX

Road/Lane Detection

The following plots show precision/recall curves for the bird's eye view evaluation.


This figure as: png eps pdf

This figure as: png eps pdf

This figure as: png eps pdf

This figure as: png eps pdf

Distance-dependent Behavior Evaluation

The following plots show the F1 score/Precision/Hitrate with respect to the longitudinal distance which has been used for evaluation.


Visualization of Results

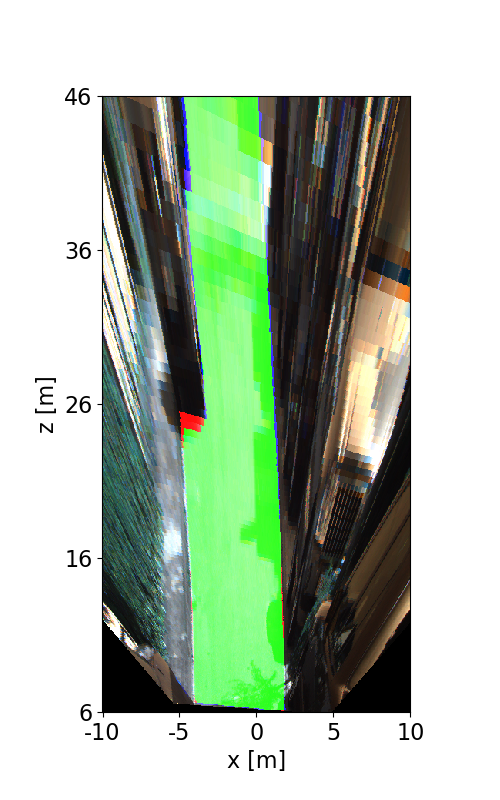
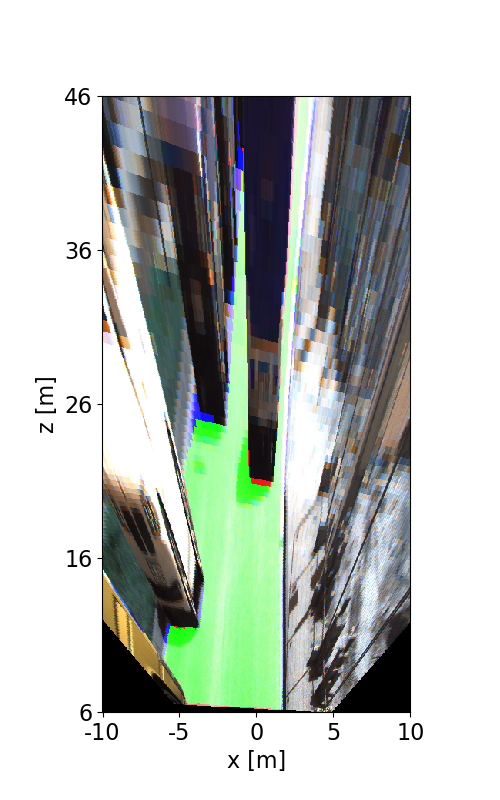
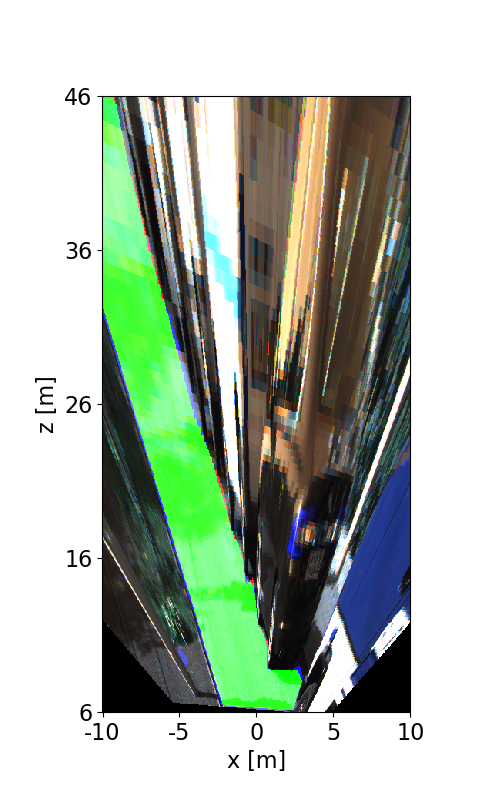
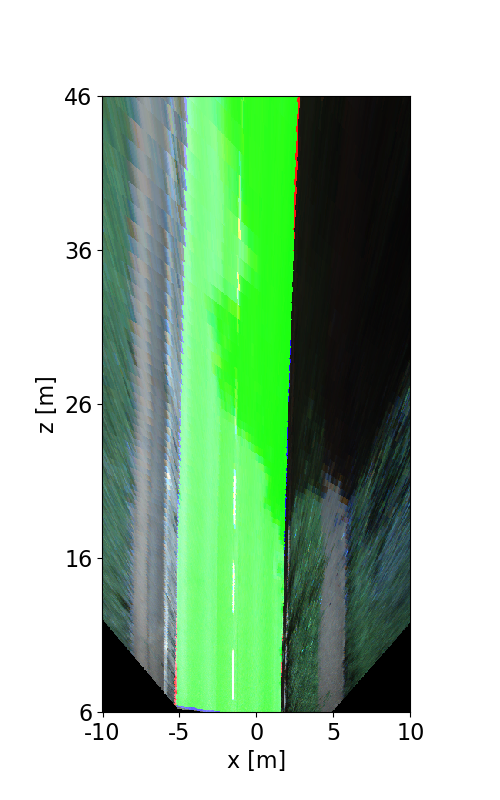
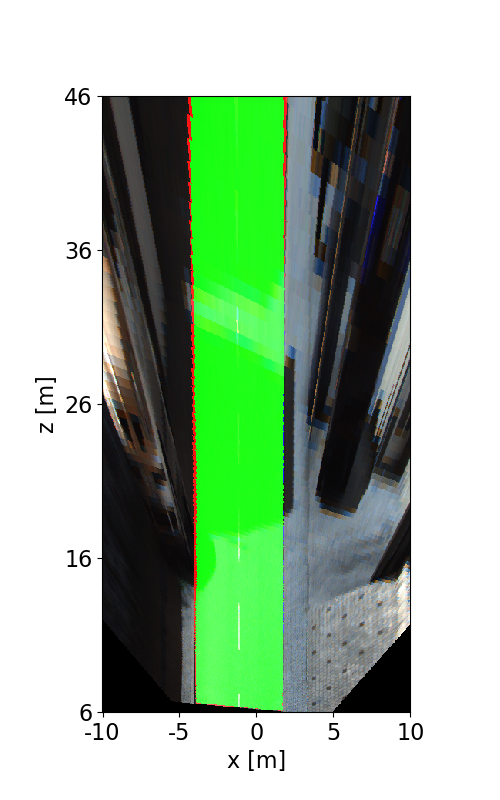
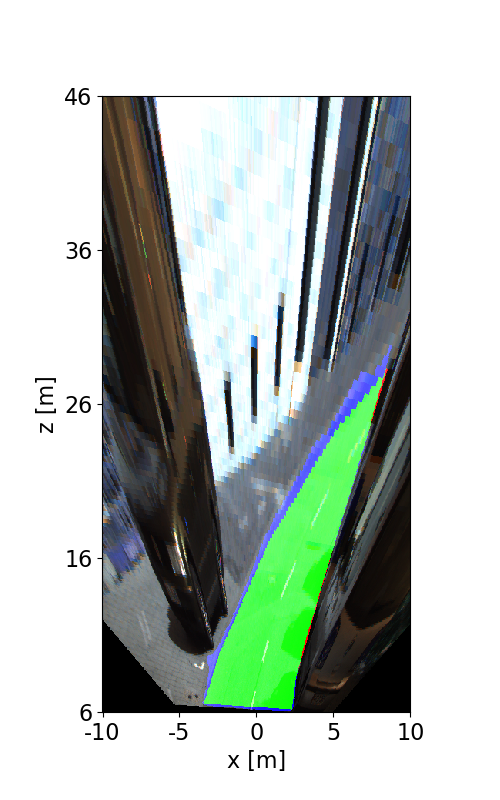
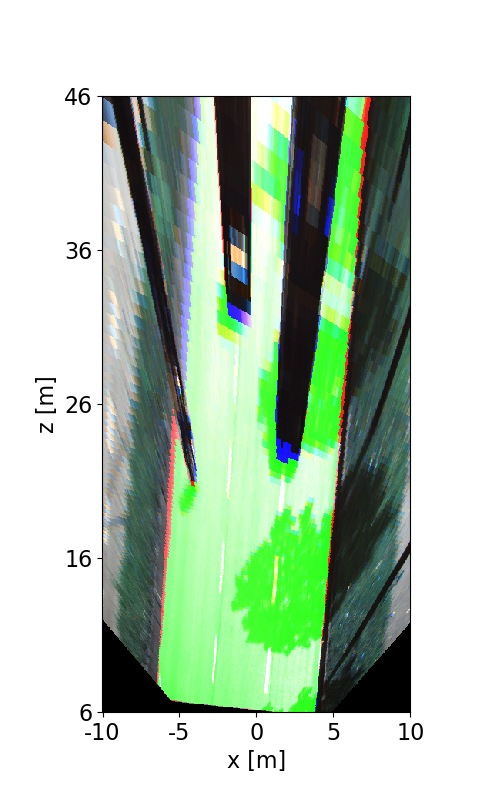
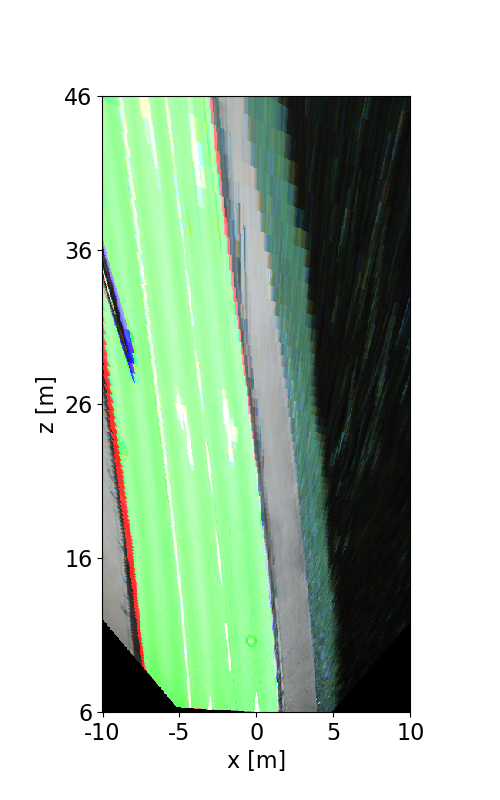
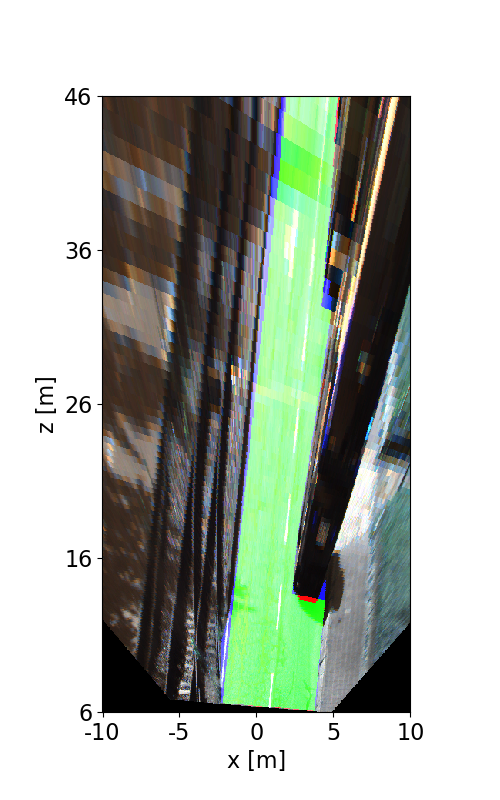
The following images illustrate the performance of the method qualitatively on a couple of test images. We first show results in the perspective image, followed by evaluation in bird's eye view. Here, red denotes false negatives, blue areas correspond to false positives and green represents true positives.


This figure as: png

This figure as: png

This figure as: png

This figure as: png

This figure as: png

This figure as: png

This figure as: png

This figure as: png

This figure as: png

This figure as: png

This figure as: png

This figure as: png

This figure as: png

This figure as: png

This figure as: png

This figure as: png

This figure as: png

This figure as: png


eXTReMe Tracker