Method

Spatial Ray Classification [SPRAY]


Submitted on 8 Oct. 2013 11:02 by
Tobias Kuehnl (Bielefeld University)

Running time:45 ms
Environment:NVIDIA GTX 580 (Python + OpenCL)

Method Description:
In a first stage, the system represents visual properties of the road surface, the boundary and lane marking elements in confidence maps based on analyzing local visual features. From the confidence maps which are converted into BEV space, SPatial RAY (SPRAY) features that incorporate properties of the global environment are computed. A boosting classifier trained with ground truth data provides confidence values. The approach can learn the spatial layout of driving scenes as the features implicitly represent both local visual properties as well as their spatial layout. The method can be trained on both road terrain categories road area and ego-lane.
Parameters:
1st stage: 102 features (color, Walsh Hadamard, SFA)
2nd stage: 205 SPRAY features (8 angles, 5 thresholds)
Latex Bibtex:
@INPROCEEDINGS{Kuehnl2012ITSC,
author = {Kuehnl, T. and Kummert, F. and Fritsch, J.},
title = {Spatial Ray Features for Real-Time Ego-Lane Extraction},
booktitle = {Proc. {IEEE} Intelligent Transportation Systems},
year = {2012},
}

Evaluation in Bird's Eye View


Benchmark MaxF AP PRE REC FPR FNR
UM_ROAD 88.14 % 91.24 % 88.60 % 87.68 % 5.14 % 12.32 %
UMM_ROAD 89.69 % 93.84 % 89.13 % 90.25 % 12.10 % 9.75 %
UU_ROAD 82.71 % 87.19 % 82.16 % 83.26 % 5.89 % 16.74 %
URBAN_ROAD 87.09 % 91.12 % 87.10 % 87.08 % 7.10 % 12.92 %
UM_LANE 83.42 % 86.84 % 84.76 % 82.12 % 2.60 % 17.88 %
This table as LaTeX

Behavior Evaluation


Benchmark PRE-20 F1-20 HR-20 PRE-30 F1-30 HR-30 PRE-40 F1-40 HR-40
UM_LANE 97.58 % 96.74 % 96.38 % 96.59 % 94.16 % 92.06 % 87.64 % 78.57 % 62.16 %
This table as LaTeX

Road/Lane Detection

The following plots show precision/recall curves for the bird's eye view evaluation.


This figure as: png eps pdf

This figure as: png eps pdf

This figure as: png eps pdf

This figure as: png eps pdf

This figure as: png eps pdf

Distance-dependent Behavior Evaluation

The following plots show the F1 score/Precision/Hitrate with respect to the longitudinal distance which has been used for evaluation.


This figure as: png eps pdf

This figure as: png eps pdf

This figure as: png eps pdf

Visualization of Results

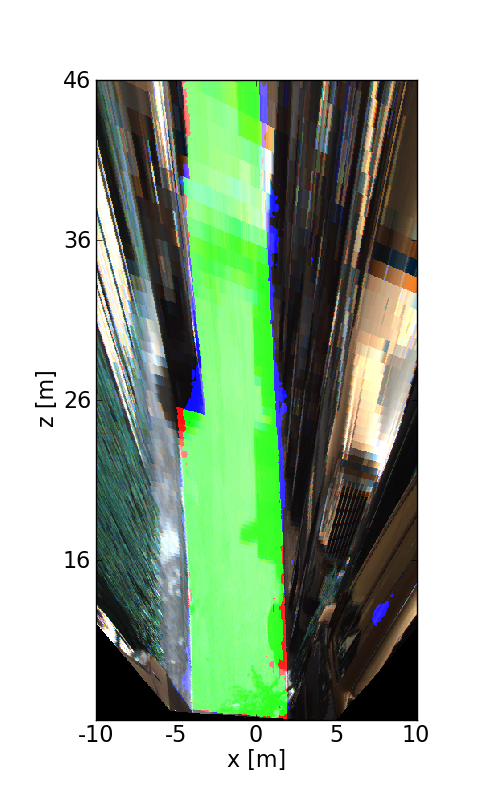
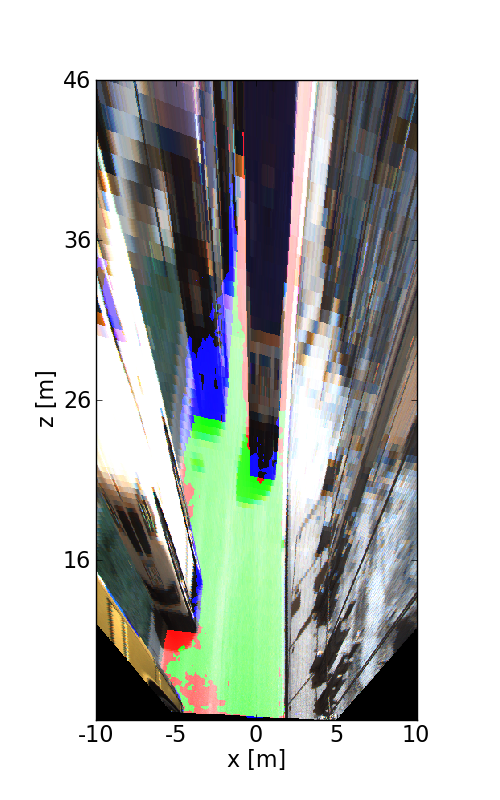
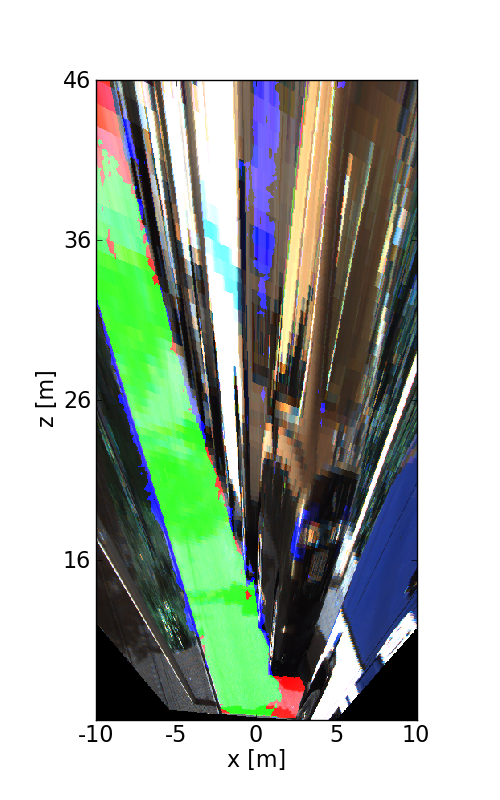
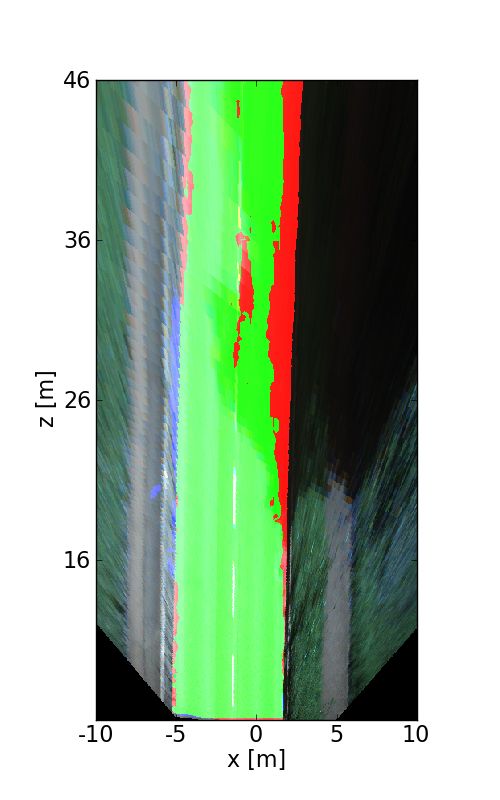
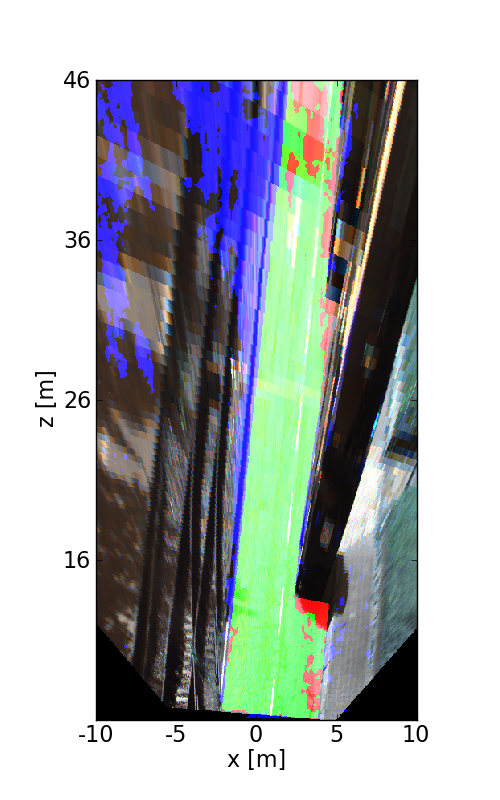
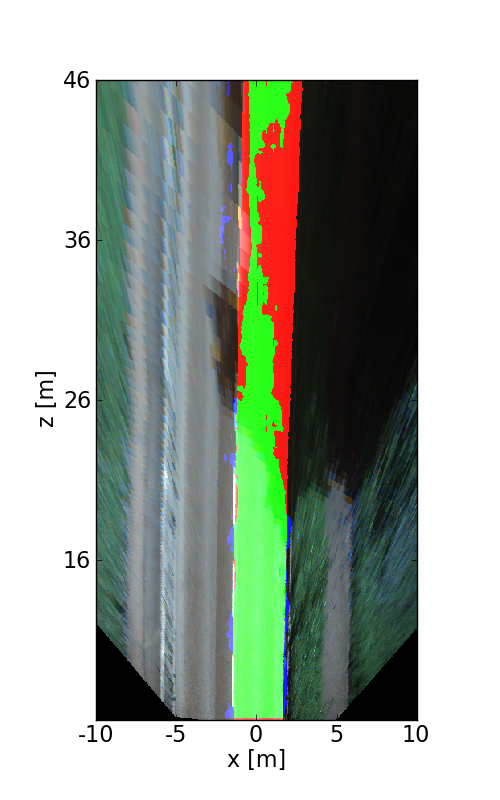
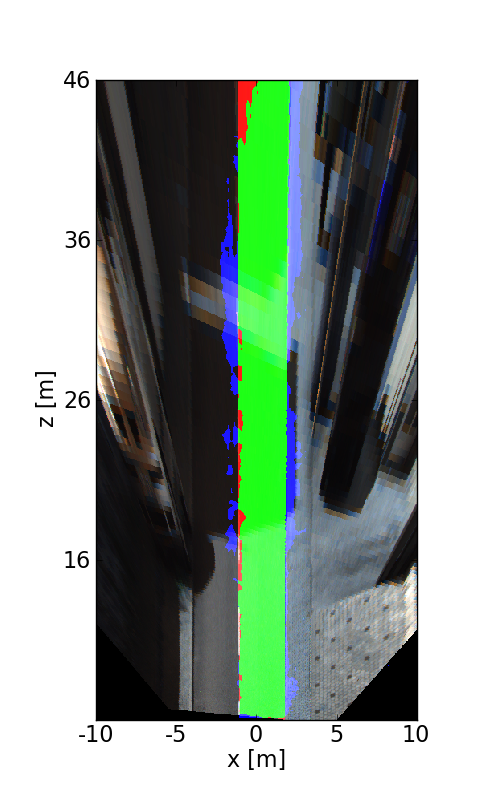
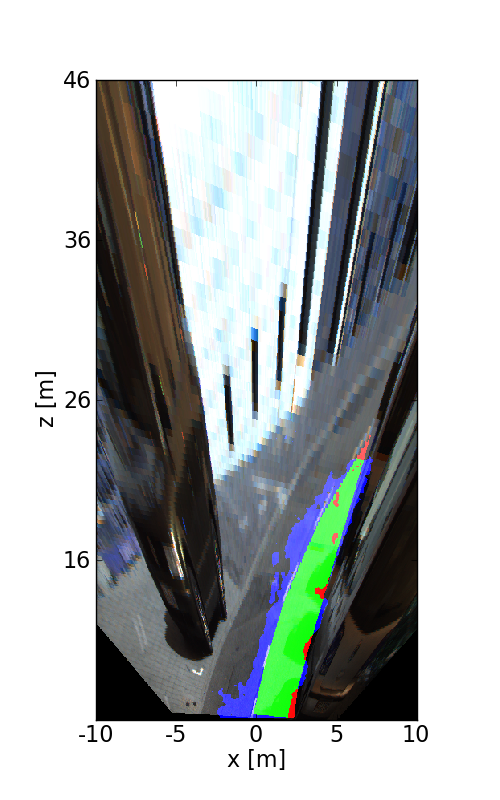
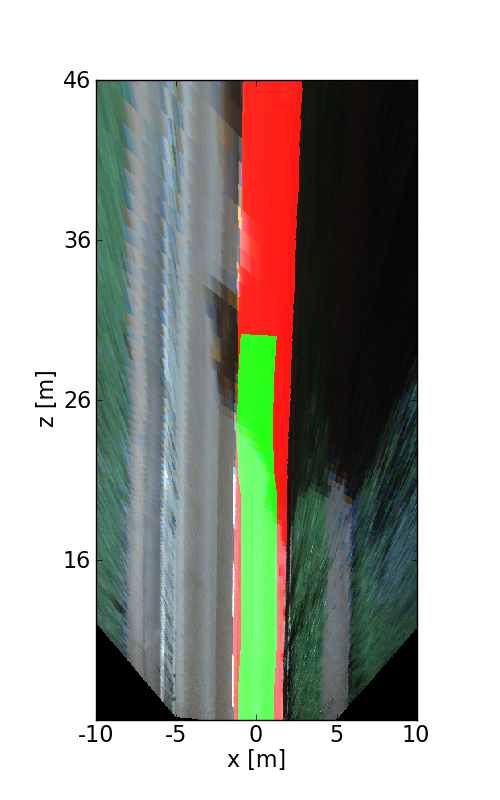
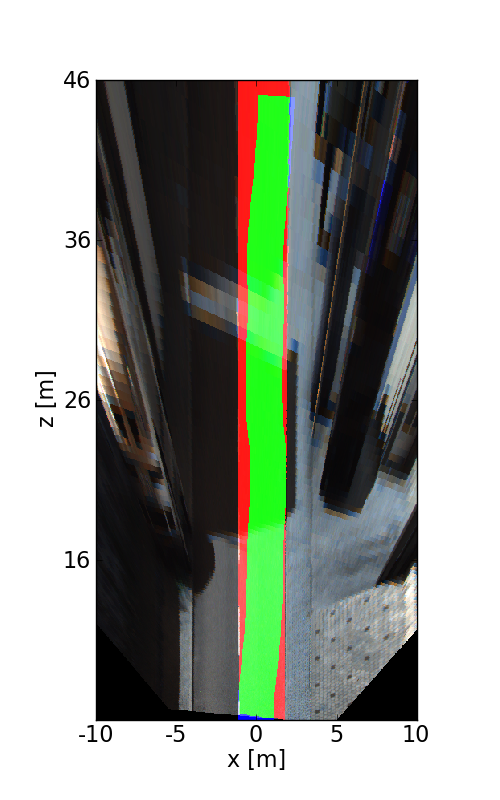
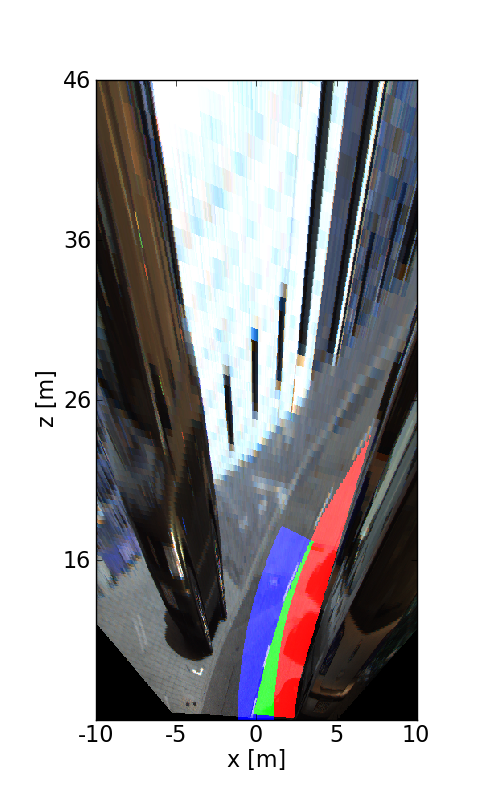
The following images illustrate the performance of the method qualitatively on a couple of test images. We first show results in the perspective image, followed by evaluation in bird's eye view. Here, red denotes false negatives, blue areas correspond to false positives and green represents true positives.


This figure as: png

This figure as: png

This figure as: png

This figure as: png

This figure as: png

This figure as: png

This figure as: png

This figure as: png

This figure as: png

This figure as: png

This figure as: png

This figure as: png
This figure as: png
This figure as: png
This figure as: png
This figure as: png
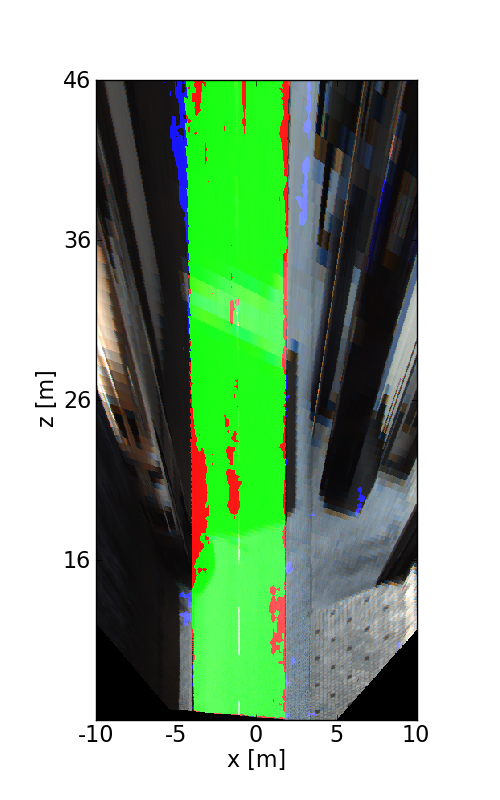
This figure as: png
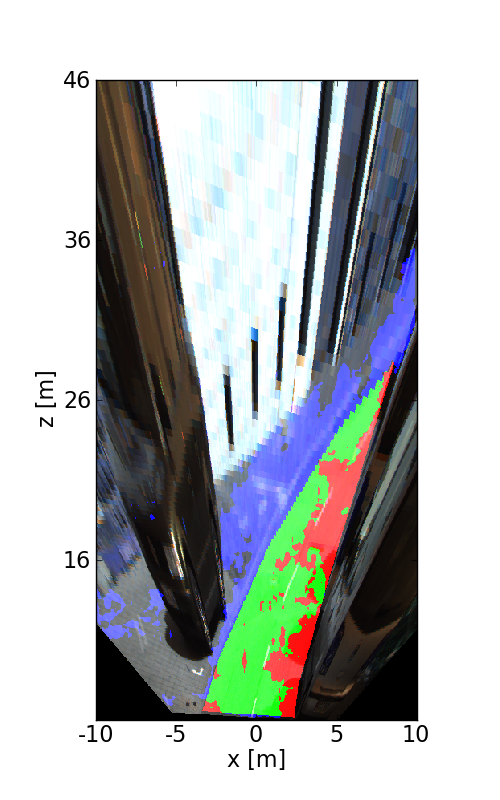
This figure as: png
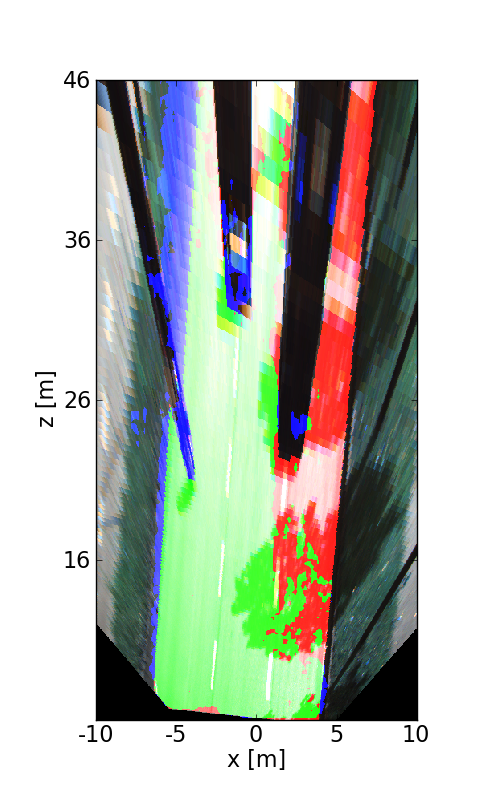
This figure as: png
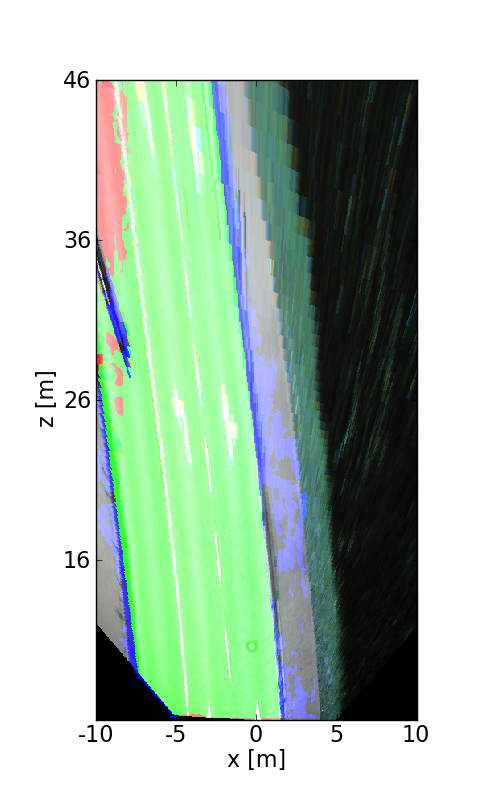
This figure as: png
This figure as: png
This figure as: png
This figure as: png
This figure as: png
This figure as: png
This figure as: png
This figure as: png


eXTReMe Tracker