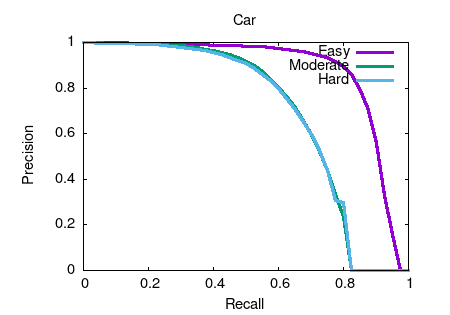
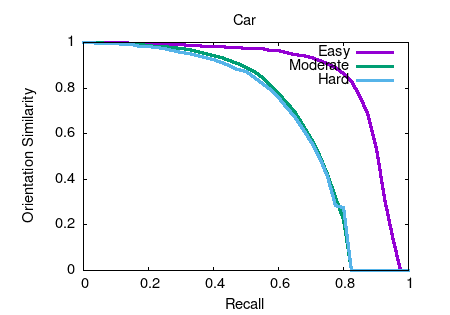
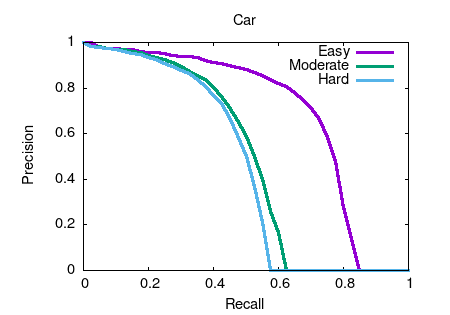
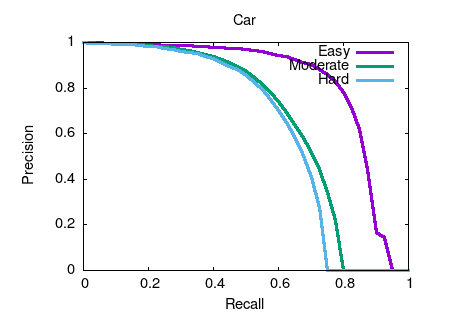
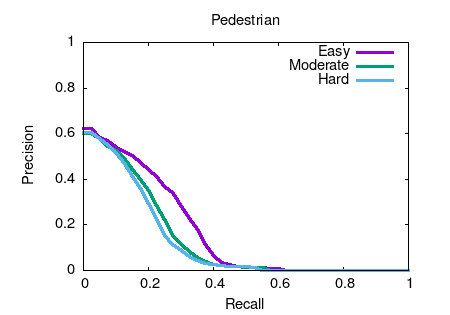
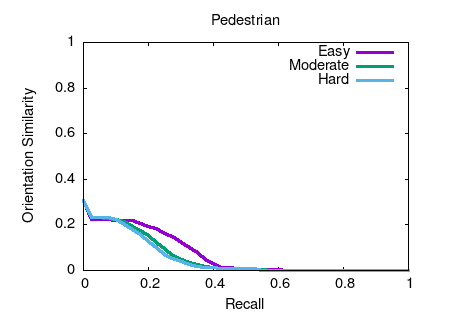
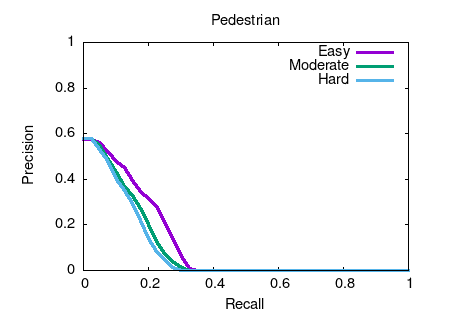
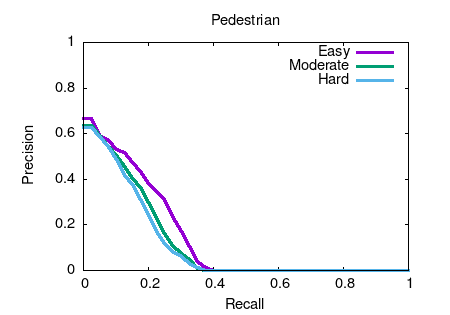
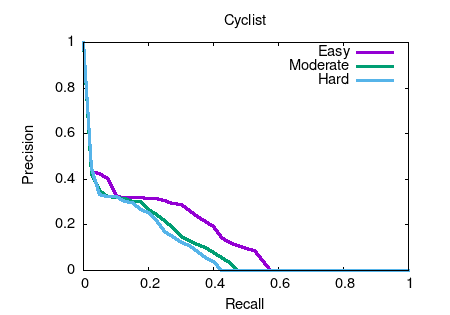
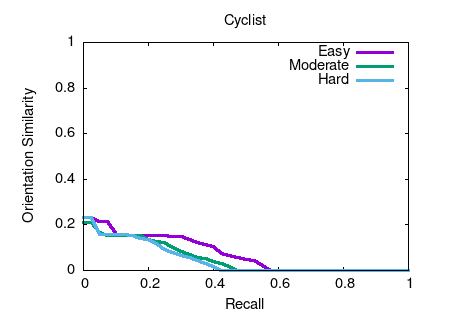
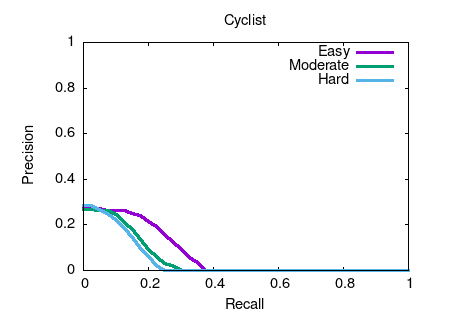
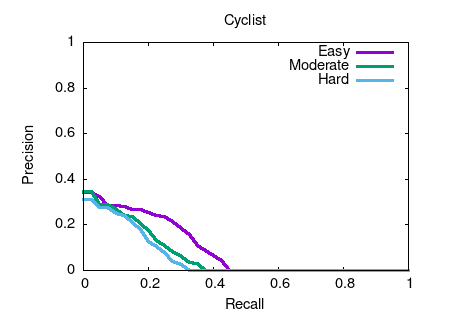
Object detection and orientation estimation results. Results for object detection are given in terms of average precision (AP) and results for joint object detection and orientation estimation are provided in terms of average orientation similarity (AOS).
| Benchmark |
Easy |
Moderate |
Hard |
| Car (Detection) |
86.87 % |
68.17 % |
67.89 % |
| Car (Orientation) |
85.83 % |
66.95 % |
65.96 % |
| Car (3D Detection) |
68.57 % |
47.04 % |
44.13 % |
| Car (Bird's Eye View) |
81.68 % |
64.77 % |
61.60 % |
| Pedestrian (Detection) |
15.97 % |
12.53 % |
11.54 % |
| Pedestrian (Orientation) |
6.68 % |
5.31 % |
4.89 % |
| Pedestrian (3D Detection) |
10.87 % |
8.66 % |
7.83 % |
| Pedestrian (Bird's Eye View) |
13.48 % |
11.09 % |
10.19 % |
| Cyclist (Detection) |
13.96 % |
9.81 % |
8.76 % |
| Cyclist (Orientation) |
7.07 % |
4.97 % |
4.49 % |
| Cyclist (3D Detection) |
6.75 % |
4.43 % |
3.84 % |
| Cyclist (Bird's Eye View) |
9.11 % |
6.27 % |
5.34 % |
This table as LaTeX
|


