Method

Selective Stereo SLAM [st] [SSLAM]
https://drive.google.com/open?id=0B_3Nh0OK9BclM0I5VC1jNndTSTA

Submitted on 27 Jun. 2013 16:39 by
Marco Fanfani (University of Florence)

Running time:0.5 s
Environment:8 cores @ 3.5 Ghz (C/C++)

Method Description:
The system estimates incremental transformations
among successive images, but only keyframes
estimated according to the motion flow are used to
get the global pose.
Parameters:
Max stereo match disparity: 300px in x, 14px in y
Max temporal match disparity: 500px
Unfixed point threshold: 55px
Min unfixed point ratio: 0.05
Latex Bibtex:
@Inbook{Bellavia2013ICIAP,
author="Bellavia, Fabio
and Fanfani, Marco
and Pazzaglia, Fabio
and Colombo, Carlo",
title="Robust Selective Stereo SLAM without Loop Closure and Bundle Adjustment",
bookTitle="ICIAP 2013",
year="2013",
publisher="Springer",
}

@article{SSLAM1,
title={Selective visual odometry for accurate AUV localization},
author={Bellavia, Fabio and Fanfani, Marco and Colombo, Carlo},
journal={Autonomous Robots},
pages={1--11},
year={2015},
publisher={Springer}
}

@article{SSLAM2,
title={Accurate Keyframe Selection and Keypoint Tracking for Robust Visual Odometry},
author={Fanfani, Marco and Bellavia, Fabio and Colombo, Carlo},
journal={Machine Vision and Applications},
pages={},
year={2016},
publisher={Springer}
}

Detailed Results

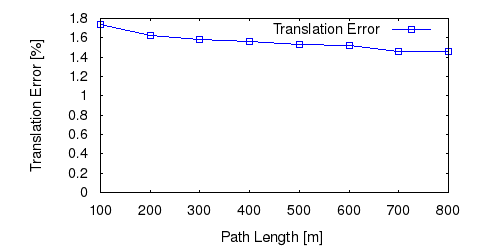
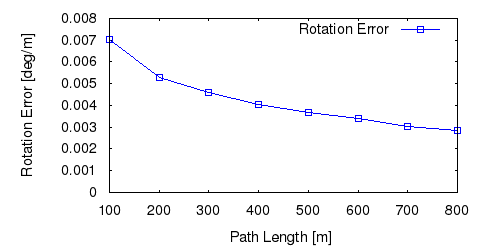
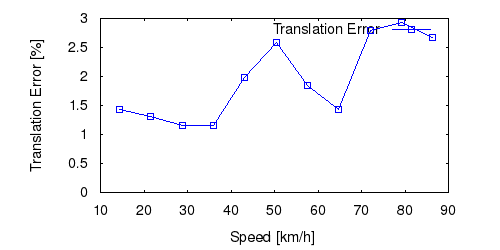
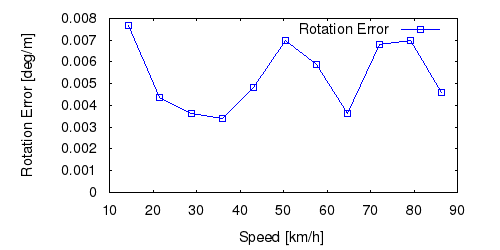
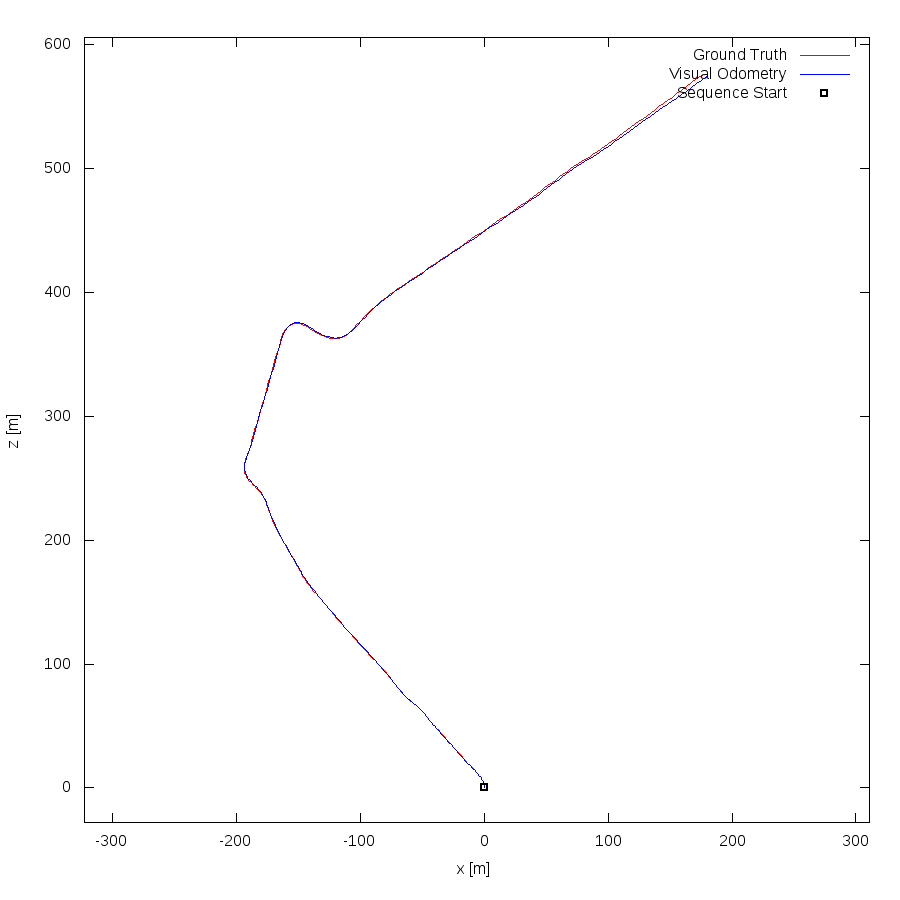
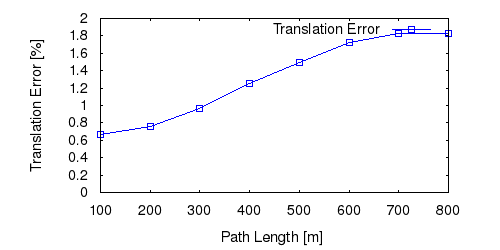
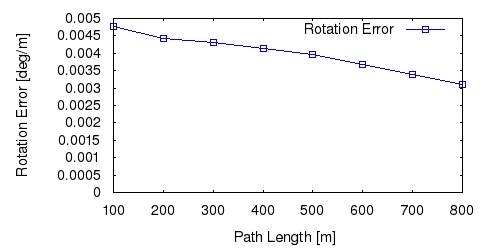
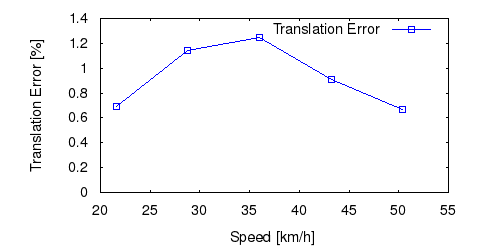
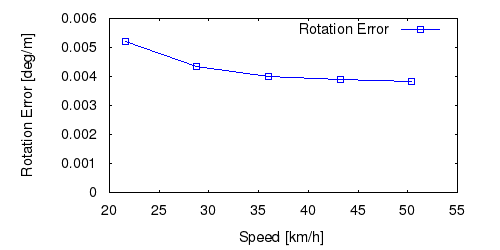
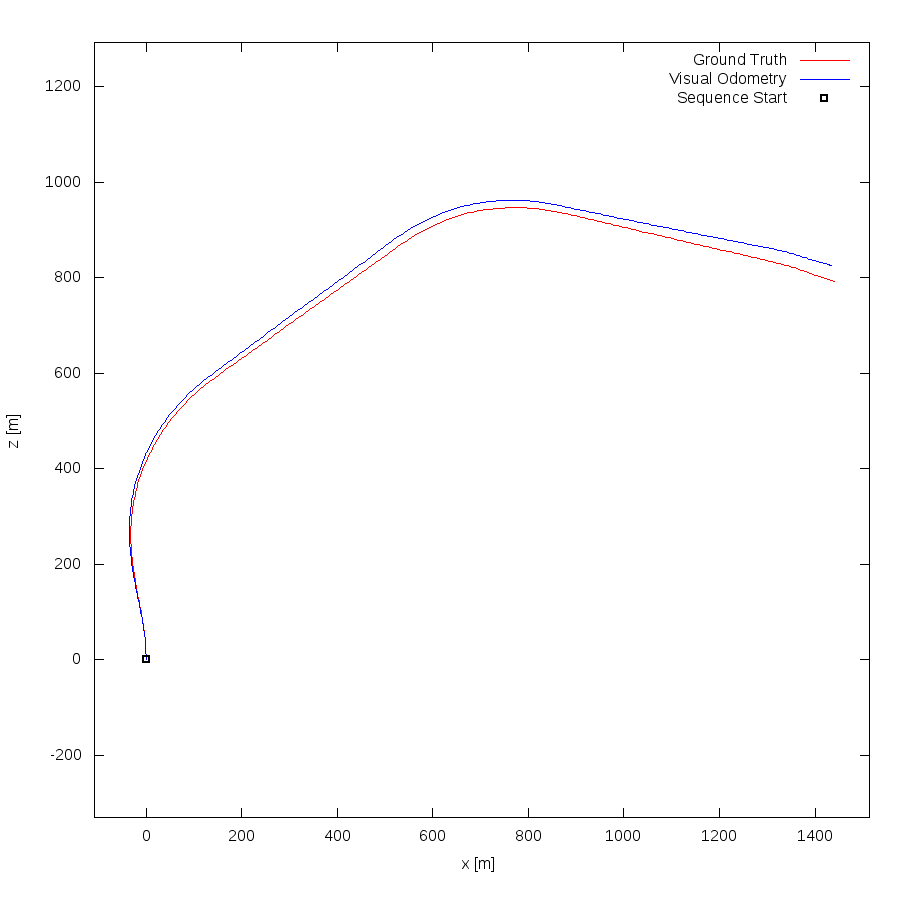
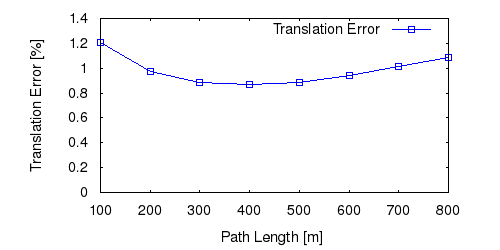
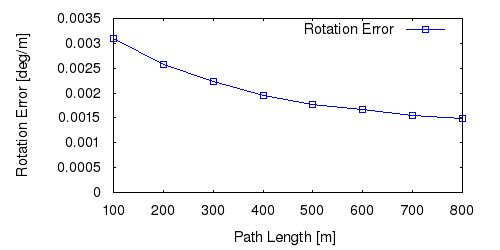
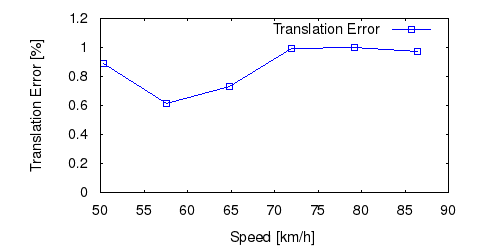
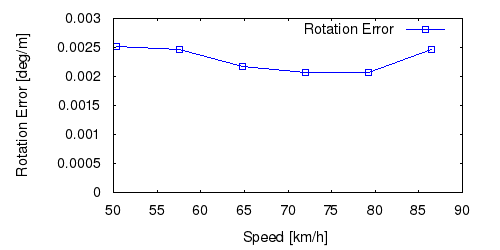
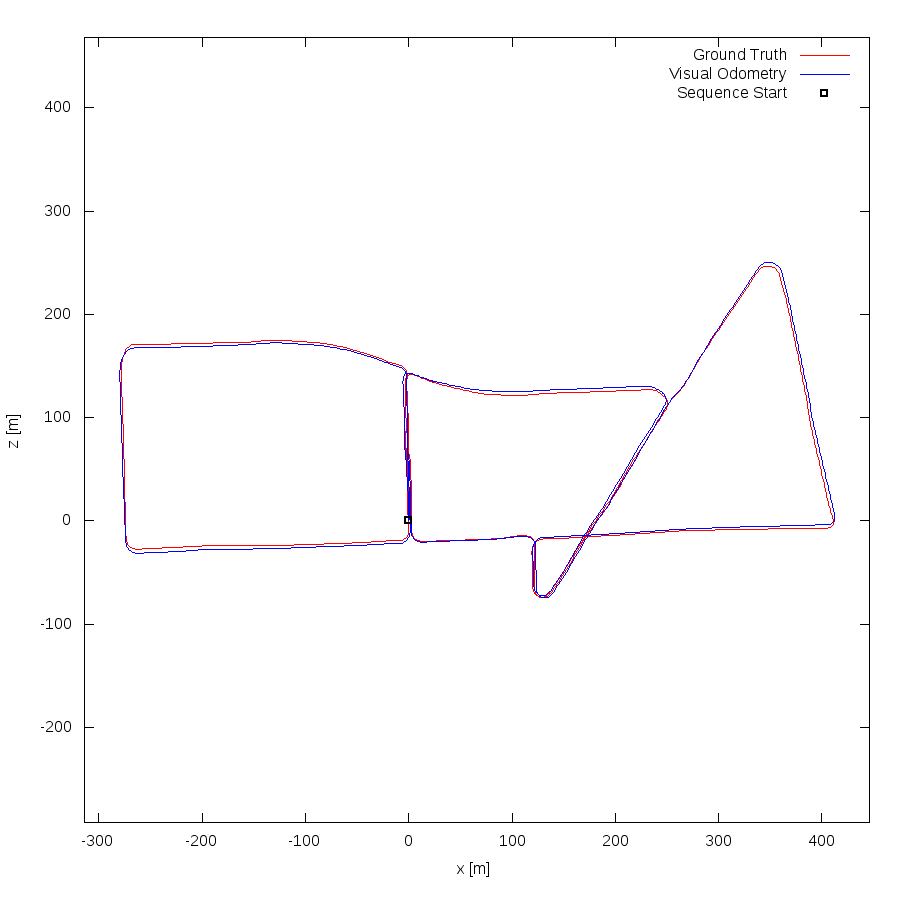
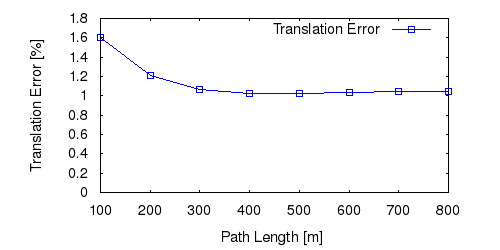
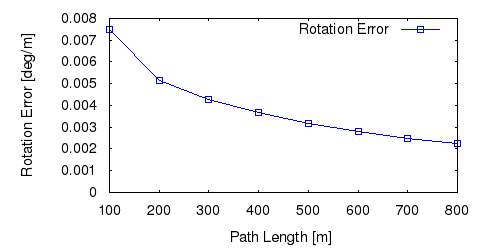
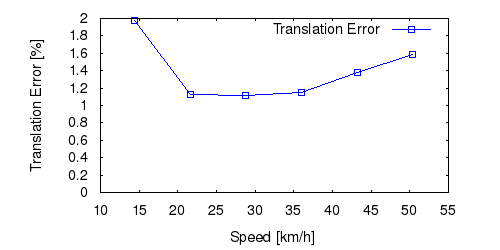
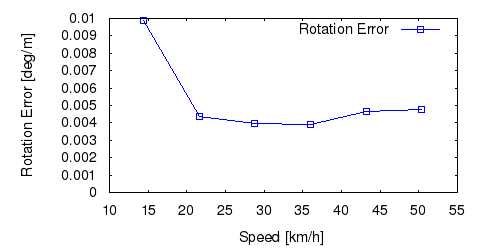
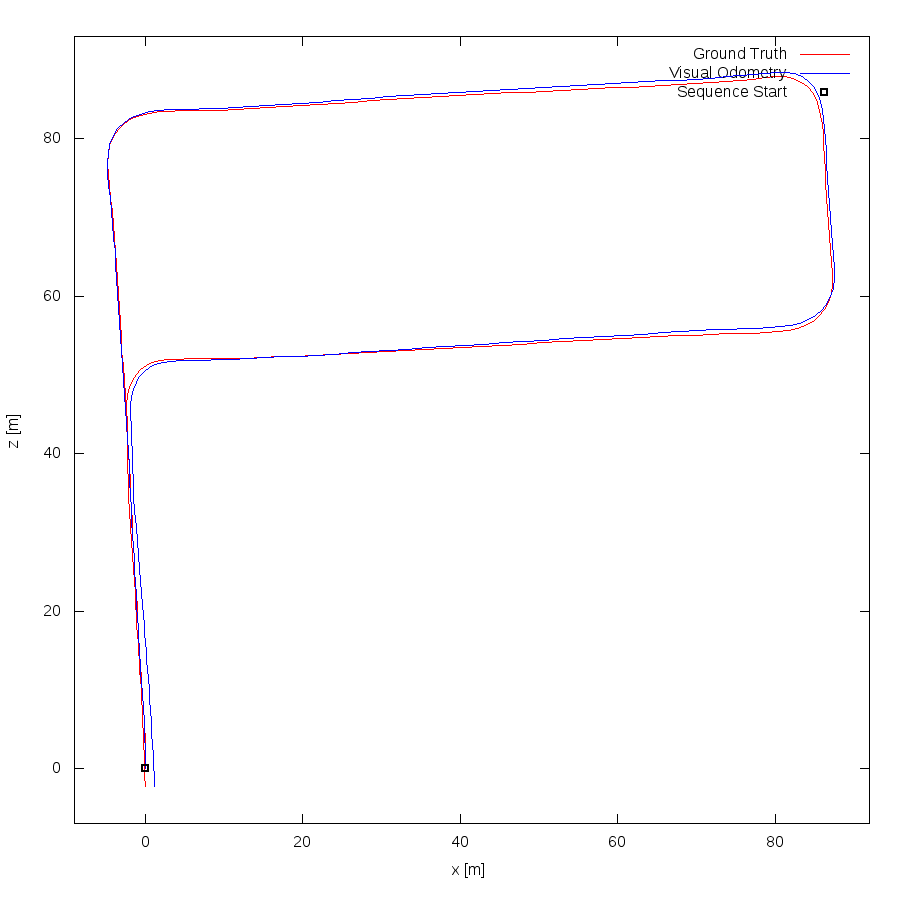
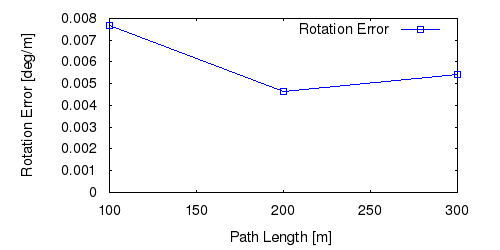
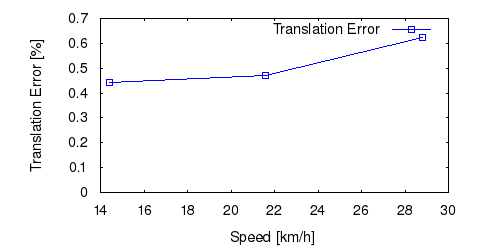
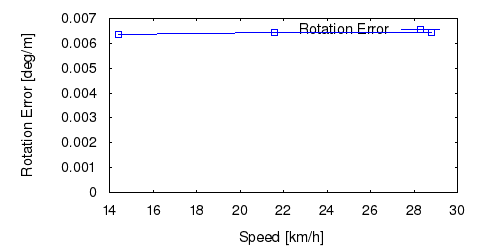
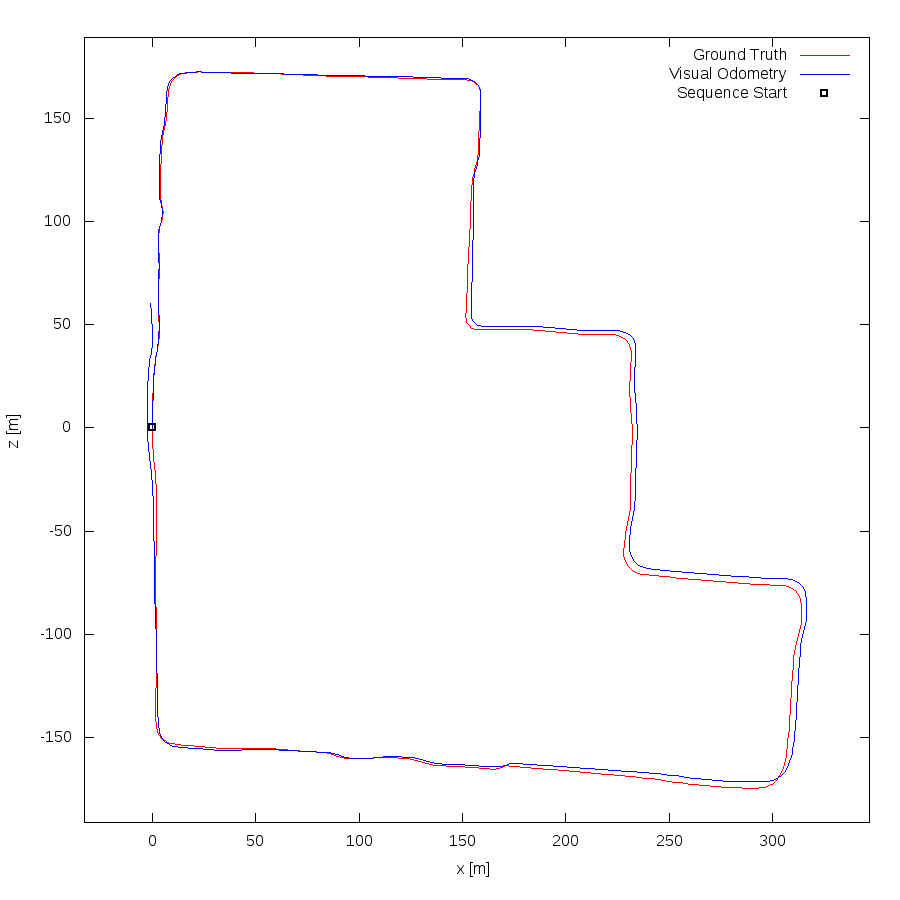
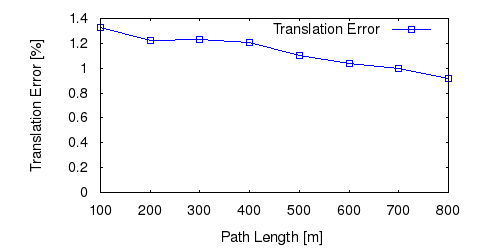
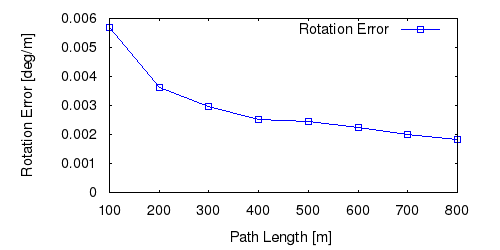
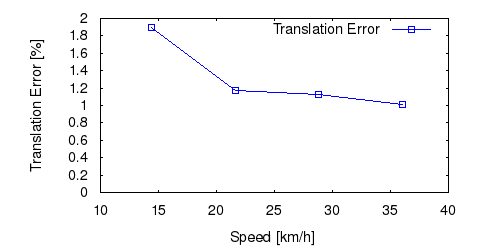
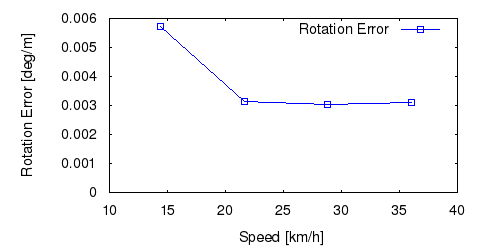
From all test sequences (sequences 11-21), our benchmark computes translational and rotational errors for all possible subsequences of length (5,10,50,100,150,...,400) meters. Our evaluation ranks methods according to the average of those values, where errors are measured in percent (for translation) and in degrees per meter (for rotation). Details for different trajectory lengths and driving speeds can be found in the plots underneath. Furthermore, the first 5 test trajectories and error plots are shown below.

Test Set Average


This figure as: png eps pdf txt gnuplot


This figure as: png eps pdf txt gnuplot


This figure as: png eps pdf txt gnuplot


This figure as: png eps pdf txt gnuplot


Sequence 11


This figure as: png eps pdf txt gnuplot


This figure as: png eps pdf txt gnuplot


This figure as: png eps pdf txt gnuplot


This figure as: png eps pdf txt gnuplot


This figure as: png eps pdf txt gnuplot


Sequence 12


This figure as: png eps pdf txt gnuplot


This figure as: png eps pdf txt gnuplot


This figure as: png eps pdf txt gnuplot


This figure as: png eps pdf txt gnuplot


This figure as: png eps pdf txt gnuplot


Sequence 13


This figure as: png eps pdf txt gnuplot


This figure as: png eps pdf txt gnuplot


This figure as: png eps pdf txt gnuplot


This figure as: png eps pdf txt gnuplot


This figure as: png eps pdf txt gnuplot


Sequence 14


This figure as: png eps pdf txt gnuplot


This figure as: png eps pdf txt gnuplot


This figure as: png eps pdf txt gnuplot


This figure as: png eps pdf txt gnuplot


This figure as: png eps pdf txt gnuplot


Sequence 15


This figure as: png eps pdf txt gnuplot


This figure as: png eps pdf txt gnuplot


This figure as: png eps pdf txt gnuplot


This figure as: png eps pdf txt gnuplot


This figure as: png eps pdf txt gnuplot


eXTReMe Tracker